
Solana (SOL) has been experiencing sharp price swings lately, with market sentiment split.
According to the current technical analysis, Solana (SOL) could rally to around $299 if it breaks above $214, while a drop below $183 might see it fall to roughly $109.
Solana is currently under strong bearish sentiment, having slid 14.72 % over the past week. At the time of writing, SOL is trading at $183, with the daily chart down 1.42 %. Both the weekly and monthly charts are also in decline, down 14.72 % and 18.68 % respectively. This sustained downtrend has sparked heated discussion within the community about altcoin price dynamics. Prominent analyst Ali Martínez used a symmetrical triangle pattern as an example, estimating that the price could swing by about 40 %.

From a technical standpoint, we dissect Solana’s recent price volatility and market mood, focusing on key support and resistance zones as well as possible upward or corrective pathways. To understand the potential future trajectory and associated risk points, keep reading. We will combine on‑chain data with industry developments to give you a more comprehensive reference.
Will Solana soar to $299 or tumble to $109?
- SOL has dropped 14.72 % over the past 7 days.
- If it breaches $214 or falls through $183, analysts anticipate a swing of roughly 40 %.
Since hitting a local high of $223, SOL has been unable to sustain the rally and has been consolidating sideways in the $184–$193 range. The current price stands at $183, with the daily chart down 1.42 %, and the weekly and monthly charts down 14.72 % and 18.68 % respectively.
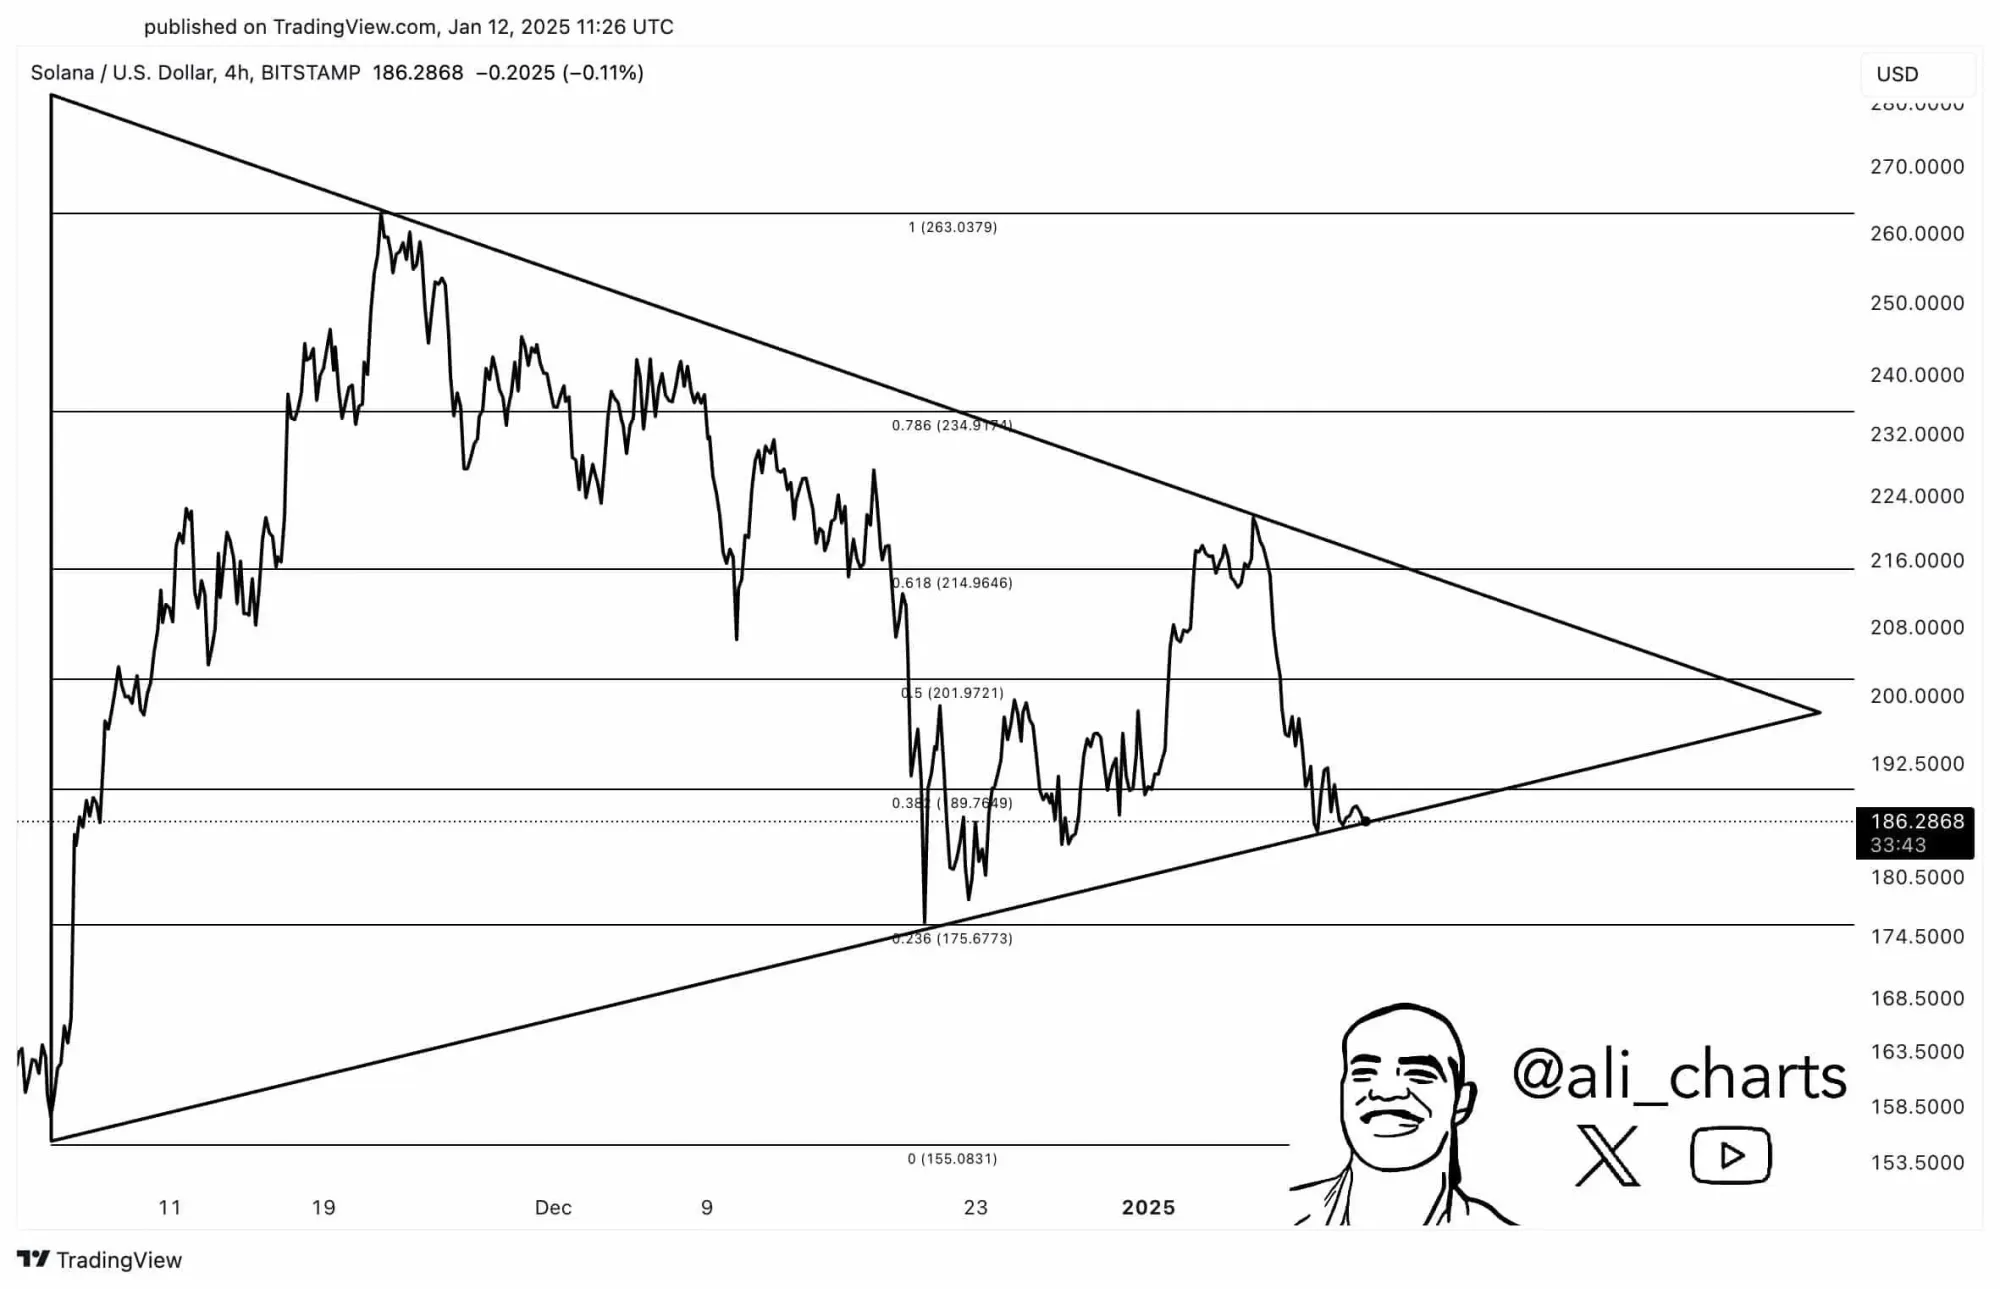
Martínez points out that SOL is currently trapped in a symmetrical triangle consolidation zone, forming lower highs and higher lows, which signals indecision between buyers and sellers. Historically, this pattern often leads to a breakout accompanied by a surge in volume. A breakout above $214 could open a path toward $299, whereas a breakdown below $183 might drive the price down to $109.
Market Sentiment
Martínez’s analysis shows SOL entrenched inside a symmetrical triangle.
Source: X
A triangular consolidation means the price is oscillating between a descending series of highs and an ascending series of lows, reflecting a market that is waiting on the sidelines. Typically, a breakout occurs near the apex of the triangle, often with a noticeable increase in trading volume.
According to Martínez, a breach of $214 or a fall below $183 could trigger a swing of about 40 %. Prices above $214 point toward $299, while prices under $183 indicate a move toward $109.
SOL Chart Outlook
The analysis above highlights SOL’s potential for dual‑directional movement: either upward or downward. The market sits at a crossroads, with buyers and sellers vying for control.
A report from AMBCrypto notes that, in the short term, SOL is being pulled by strong bearish sentiment, which could lead to further corrections.
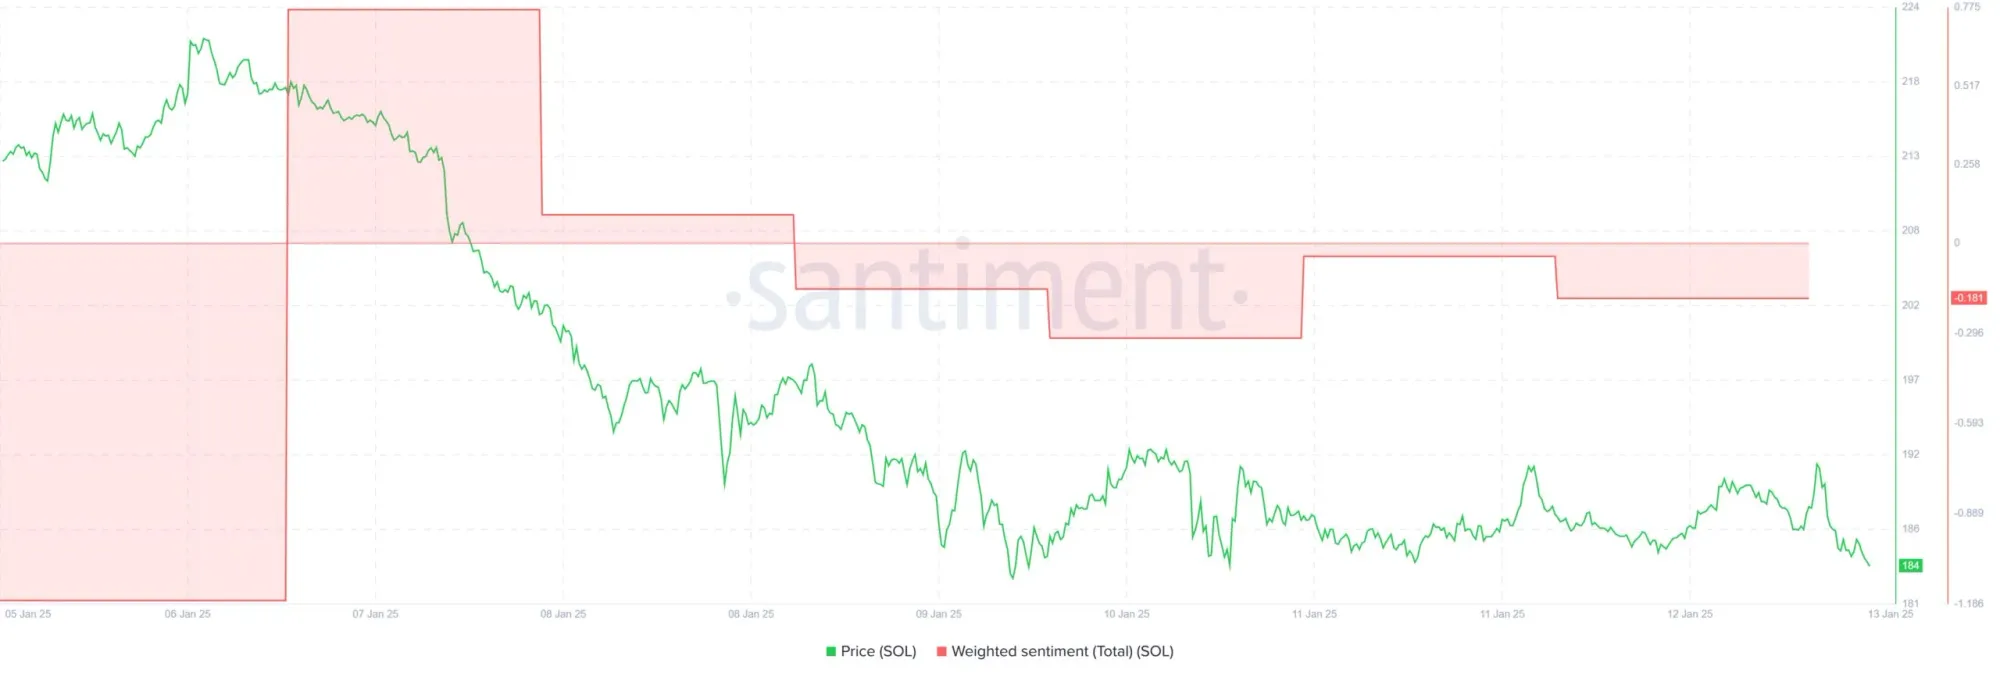
Source: santimment
Over the past four days, sentiment has been broadly negative, and the recent sentiment index has turned bearish, indicating an intensifying sell‑side bias.
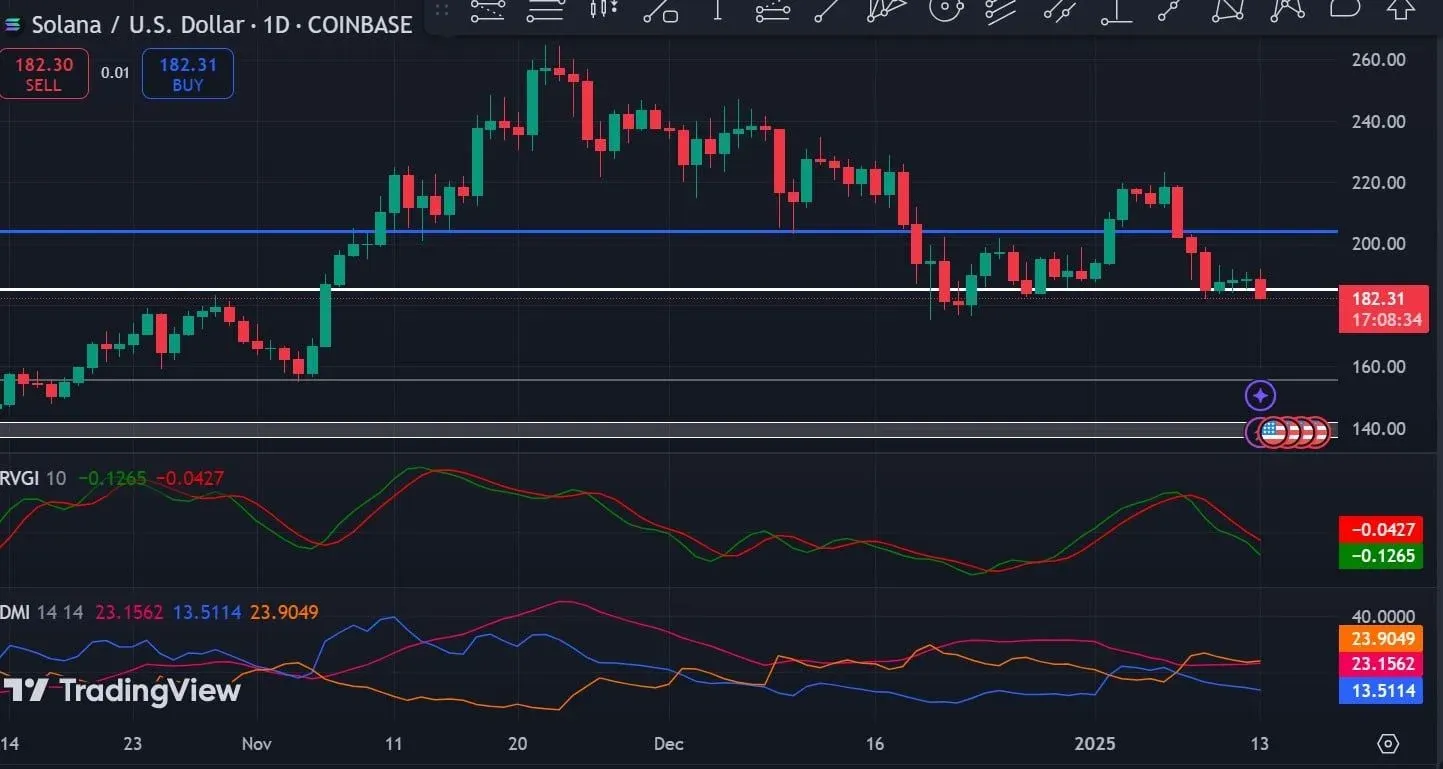
Source: TradingView
In addition, SOL’s Directional Movement Index (DMI) shows mounting downward pressure: the +DI has dropped to 13, while the ADX has risen to 23, suggesting that the bearish momentum is strengthening.
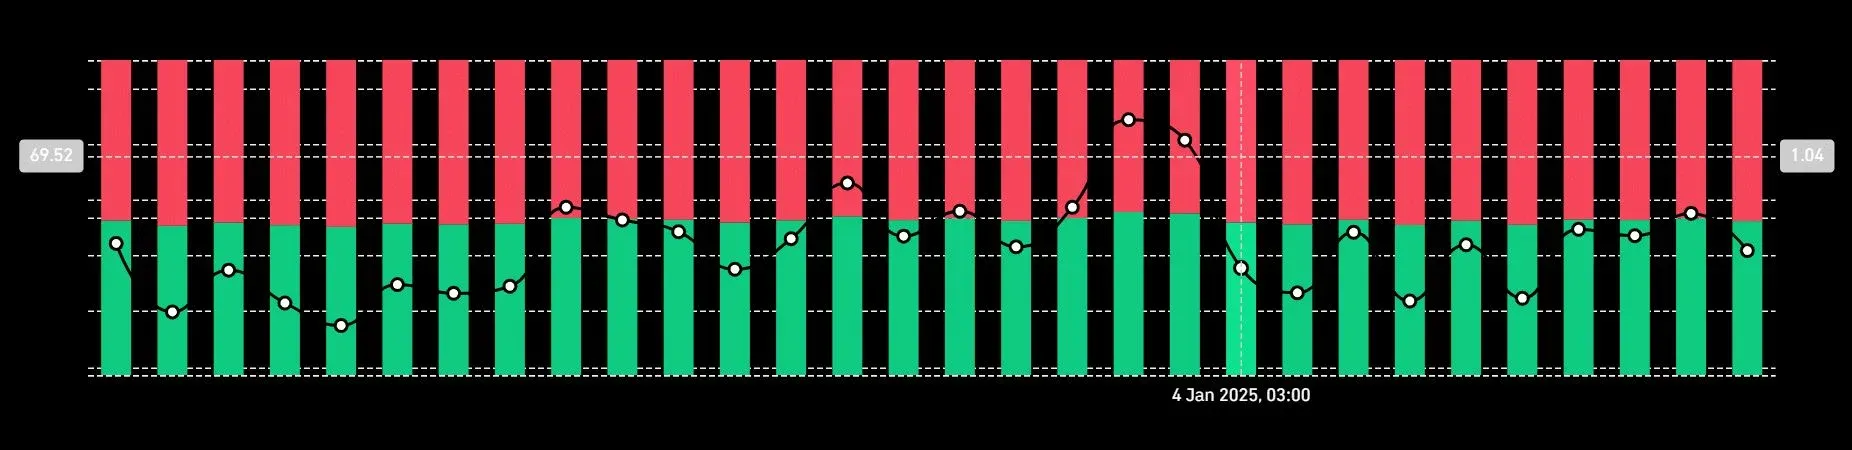
Source: Coinglass
Positioning data reveals that short‑sellers account for 52 % of open interest, while longs hold 48 %, implying that the majority of traders expect further price declines.
In short, SOL is undergoing pronounced bearish sentiment. If it breaks out of the consolidation zone, support is expected around $175; if it stays above the zone, a rebound toward the $220 resistance level is possible.
Solana Price Forecast: Backpack CEO Backs SOL, Stock Tests $93 Breakout (2024‑03‑25)
- SOL closed at $92.25, up 1.64 %, sitting within the 0.5–0.618 Fibonacci range.
- U.S. SOL spot ETF recorded a daily net inflow of $4.64 million, bringing the cumulative inflow to nearly $994 million.
- Backpack CEO described Solana as the only network that must be added, calling it the most liquid DeFi market globally.
On March 25, SOL was priced at $92.25. The 2‑hour chart shows the token moving inside a descending channel, while the daily chart is being pressed down by four moving averages. ETF inflows have improved, and the CEO’s endorsement provides a fundamental boost, yet a decisive breakout is still required for a constructive trend.
All four exponential moving averages (EMA) are positioned above the price and are sloping downward, indicating bearish pressure.
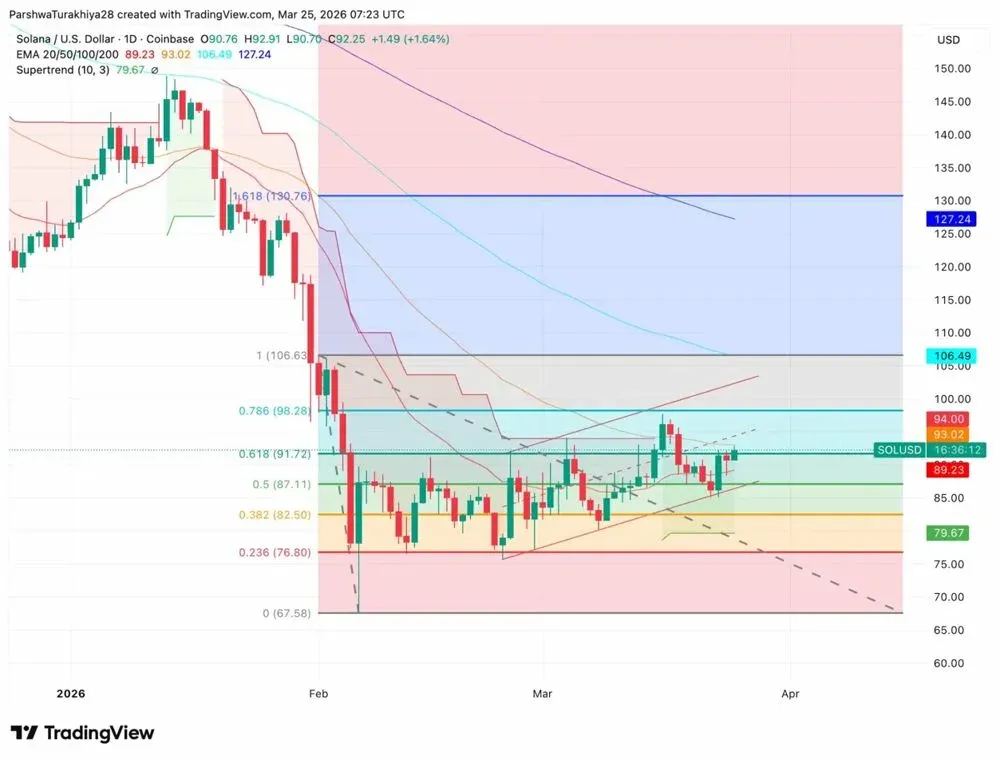
Daily price movement of SOL (Source: TradingView)
- 20‑day EMA: $89.23
- 50‑day EMA: $93.02
- 100‑day EMA: $106.49
- 200‑day EMA: $127.24
The SuperTrend line at $79.67 has turned into support and now serves as the only bullish signal on the daily chart. Should the price break above $93.02, it would cross the 50‑day EMA and could initiate a new upward leg.
Key Levels
| Level | Price |
|---|---|
| SuperTrend Support | $79.67 |
| 0.5 Fibonacci Support | $87.11 |
| 0.618 Fibonacci Resistance | $91.72 |
| 20‑day EMA | $89.23 |
| 50‑day EMA | $93.02 |
| 0.786 Fibonacci Target | $98.28 |
| Full Retracement Level | $106.63 |
2‑Hour Chart Analysis
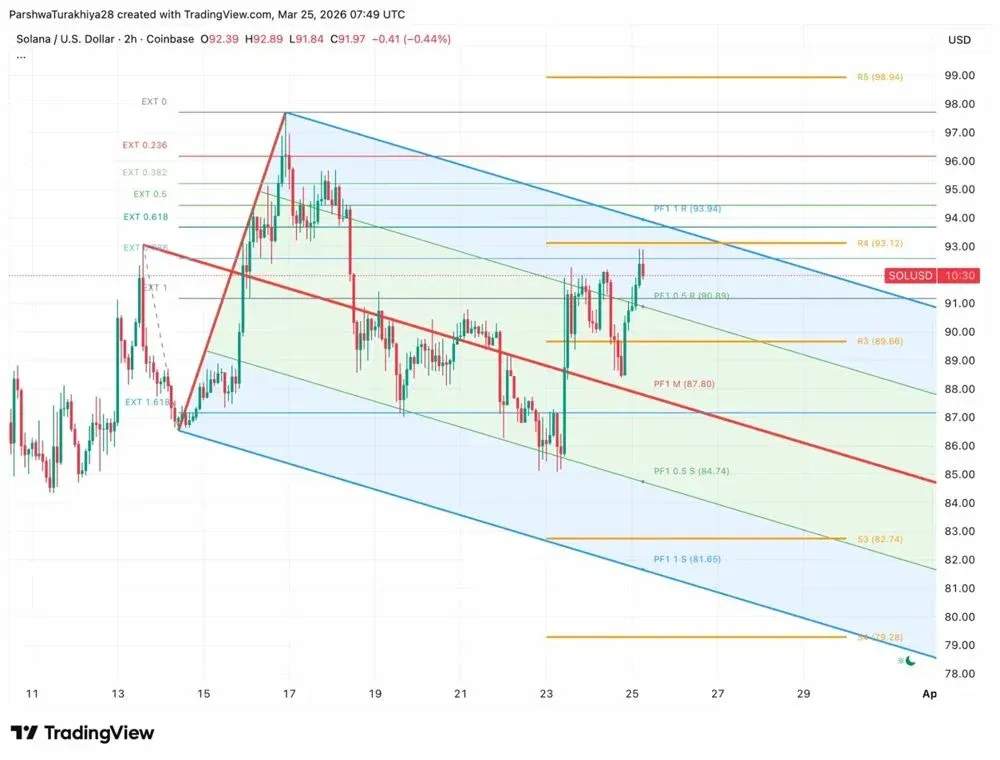
2‑hour price movement of SOL (Source: TradingView)
Since the $97.50 high on March 17, SOL has been confined to a descending channel whose upper trend line tilts toward the $93–$94 region. After dipping to $85.60, the price rebounded to $92, approaching the channel’s upper bound at $93.94. A 2‑hour close above $93.94 would unlock resistance levels R4 ($93.12) and R5 ($98.94); the next support level is 0.5S at $84.74.
Key Levels (2‑hour)
- Channel‑top resistance: $93.94
- R4 resistance: $93.12
- R5 resistance: $98.94
- Mid‑channel support: $90.89
- Lower support: $84.74
ETF Flows & DeFi Case Study
On March 24, the U.S. SOL spot ETF saw a daily net inflow of $4.64 million, bringing the cumulative net inflow to $994.43 million with total net assets of $881.53 million. Bitwise’s BSOL led the pack with a $2.97 million inflow, followed by Franklin Templeton’s SOEZ with $1.53 million. Since mid‑March, outflows have steadied or turned slightly positive, suggesting that institutional holdings are stabilizing.
The Backpack CEO reiterated this week that, if a crypto project must pick a network, Solana is the only choice, describing it as the most liquid and scalable DeFi market worldwide. Such institutional viewpoints carry more weight than social‑media noise, and when combined with robust ETF inflows, they further buttress the fundamentals.
Outlook
- Bullish Scenario: A 2‑hour close above $93.94, a break of the 50‑day EMA ($93.02) and accompanying volume surge could push SOL toward the 0.786 Fibonacci target of $98.28, then toward the full retracement level of $106.63. Should ETF cumulative inflows surpass $1 billion, that could act as additional upward catalyst.
- Bearish Scenario: If the price falls below the 20‑day EMA ($89.23) and breaches the $87.11 support, the next target would be $82.50 (the 0.382 Fibonacci level), with further support at $79.67. A deeper decline could revisit the February low around $67.58.
Solana Price Forecast: 2025‑2036
SOL has risen 3.27 % over the past 24 hours. Below are projected price ranges (average, low, high) for various years, expressed in USD:
| Year | Average Price | Low | High |
|---|---|---|---|
| 2025 | $206.26 | $165.00 | $247.51 |
| 2026 | $242.04 | $193.63 | $290.45 |
| 2027 | $280.60 | $224.48 | $336.72 |
| 2028 | $293.22 | $234.57 | $351.86 |
| 2029 | $385.25 | $308.20 | $462.31 |
| 2030 | $405.70 | $324.56 | $486.84 |
| 2031 | $515.31 | $412.25 | $618.37 |
| 2032 | $502.37 | $401.90 | $602.85 |
| 2033 | $547.69 | $438.15 | $657.22 |
| 2034 | $690.03 | $552.02 | $828.03 |
| 2035 | $799.67 | $639.74 | $959.60 |
| 2036 | $906.86 | $725.49 | $1,088.23 |
Note: These forecasts are derived from a composite model that blends historical price behavior, technical indicators, and community sentiment. They are for reference only and do not constitute investment advice.
Key Support & Resistance
- Weekly lowest support: $19
- Highest resistance: $250
- Market sentiment in September 2024: mildly bearish
AI/ML‑based projections place SOL’s average price around $400 in 2030 and near $800 by 2035.
Where Can You Trade SOL?
SOL is listed on 46 exchanges, including Binance, OKX, Huobi, Gate.io, Coinbase, KuCoin, Bitfinex, Kraken, Gemini, MEXC, and others. Below is a snapshot of several major platforms (U.S. residents should use Binance.US rather than the global Binance site):
- Binance – The world’s leading digital‑asset platform, serving over 190 countries. *(U.S. users: Binance.US)*
- Huobi – A digital‑economy firm focused on core blockchain technology and ecosystem development.
- OKX / OKEx – Provides a unified account, MetaX multi‑chain wallet, NFT marketplace, and full‑chain services.
- Gate.io – An established exchange offering both centralized and decentralized security layers.
- Coinbase – A U.S.‑regulated exchange with a global user base exceeding 35 million.
- KuCoin – The “people’s exchange,” offering multilingual support and 24/7 customer service.
- Bitfinex – Hong‑Kong‑based platform that offers high‑leverage margin trading.
- Kraken – A veteran exchange in Europe and the U.S., supporting multiple fiat corridors via SEPA and SWIFT.
- Upbit – A mainstream Korean platform under local regulation, listing 175 cryptocurrencies.
- Bitget – Holds licenses across several jurisdictions and provides contracts, wealth‑management products, and more.
How to Purchase SOL (Example Using OKX)
- Visit the OKX website, click “Register,” enter your email address, and complete the captcha verification.
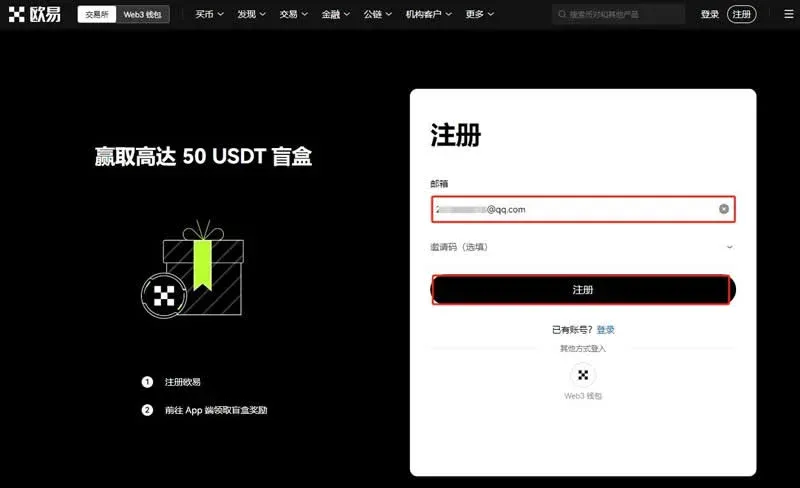
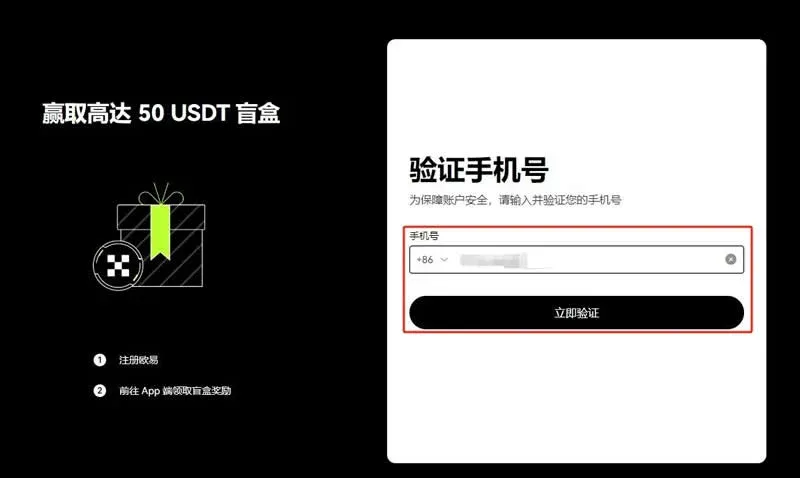
- Input your mobile number, request the 6‑digit SMS code, and submit it.
- Choose your country/region of residence, and tick the boxes for “Terms of Service,” “Risk & Compliance Disclosure,” and Privacy Policy.
- Set a password (8‑32 characters
Related Reading
- Decred (DCR) Review: Community‑Driven Crypto with Sustainable Governance
- SOL Price Analysis: Can Solana Stay Above $180?
- Is DCR a Scam? Decred Trust, Bitcoin‑Like Features & Governance
💡 Register on Binance with referral code B2345 for the maximum trading fee discount. See Binance complete guide.
⚠️ Risk Disclaimer: Crypto prices are highly volatile. This is not investment advice.


