
Based on historical trends and technical analysis, the price of TRX is expected to range between $0.27‑$0.42 in 2026 and could reach $0.65‑$0.85 by 2030.
In this article we outline TRON’s recent market trajectory, deeply examine its technological evolution, ecosystem development, and regulatory environment, and assess how these factors could influence price. By comparing multi‑dimensional data, readers can grasp the growth logic and risk points for TRX over the coming years. Subsequent sections will further explain the key drivers—worth a careful read.
Key Takeaways
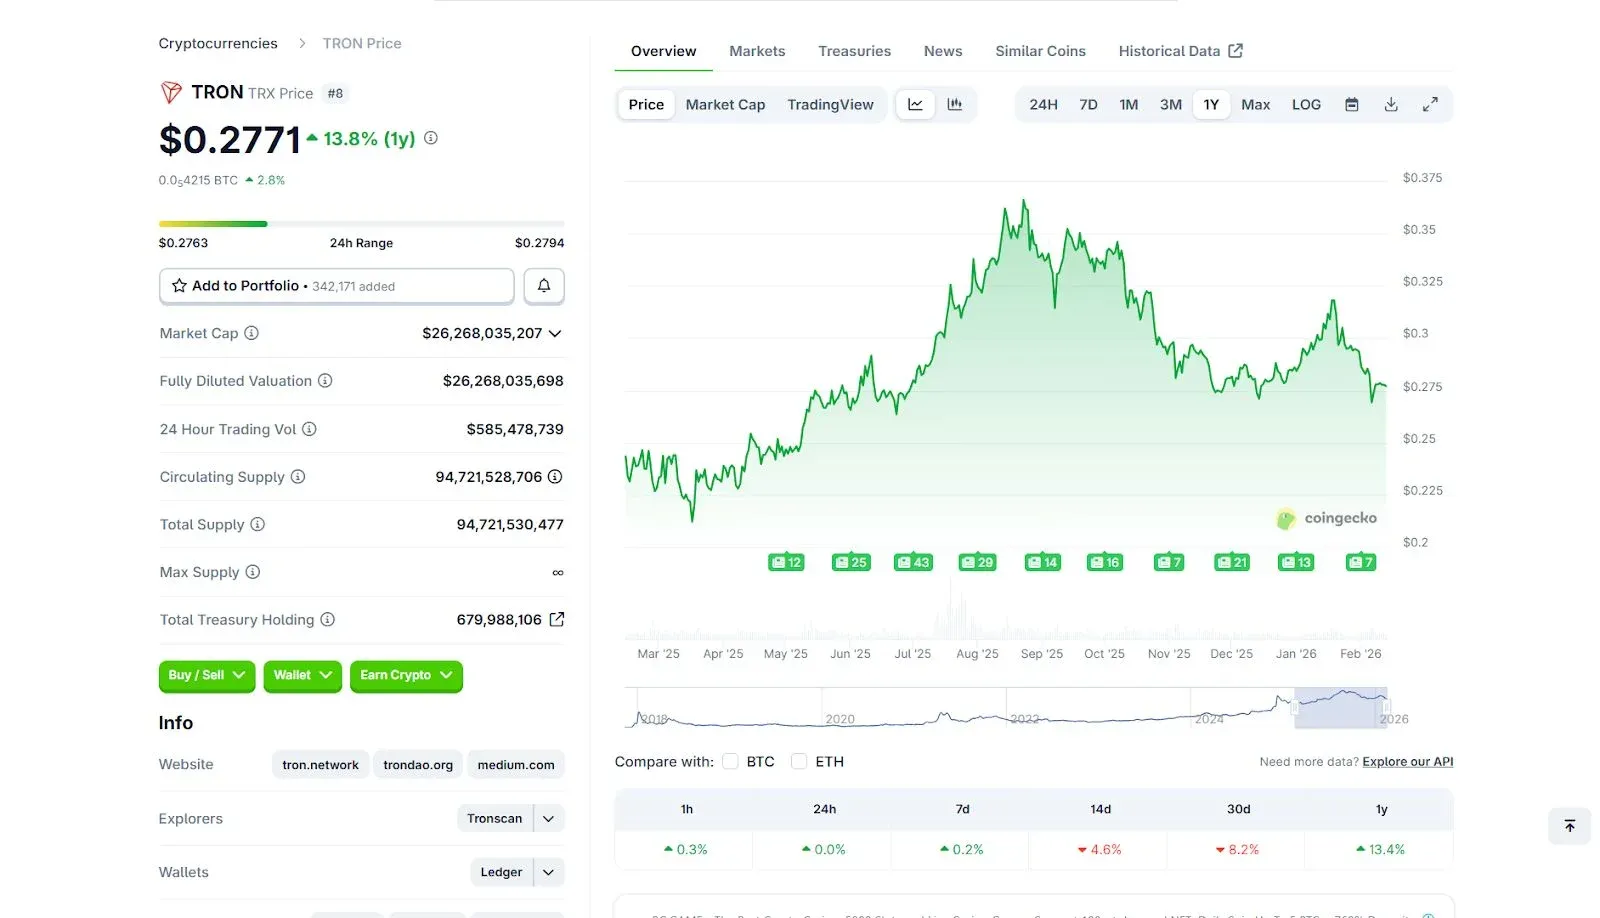
- TRX is currently trading around $0.278, showing signs of stabilization after recent market pressure.
- The 2026 price band is projected at $0.27‑$0.42, with an average near $0.35, implying an expected return of roughly 25 %.
- By 2030, network expansion and partnership initiatives could push the price above $0.85.
- Main influencing factors include user adoption, technology upgrades, regulatory policy, and overall crypto‑market sentiment.
The TRON price outlook suggests steady growth, with the token demonstrating resilience in a turbulent crypto market. As of mid‑February 2026, TRX trades at about $0.278, a modest rebound from recent declines, helped by network improvements and rising user activity.
Experts believe that as more applications and services rely on TRON’s fast, low‑cost platform, TRX retains upside potential. If the broader market trend remains positive, TRX could stand out in the years ahead.
Below we systematically analyze TRON’s historical performance, current market standing, technical prospects, and a reasonable price range for 2026‑2030.
TRON (TRX) Overview
TRON was founded by Justin Sun in 2017 with the goal of making digital content sharing more convenient and affordable. The platform focuses on entertainment and application domains, enabling creators to interact directly with fans and bypass large intermediaries.
Thanks to high‑speed transactions and low fees, TRON enjoys popularity in gaming, video streaming, crypto staking, and online financial‑tool use cases. Its native token TRX is used for network payments and rewards, helping TRON become one of the blockchain projects with the largest user base.
TRX Market Overview
As of 12 February 2026, TRX’s market capitalization stands at roughly $26 billion, placing it among the top ten cryptocurrencies. Daily trading volume is about $603 million, indicating strong interest from both buyers and sellers.
The total token supply exceeds 94 billion, with a high circulation ratio. Recent performance has been relatively stable, with a modest daily increase of around 1 %, though a slight pull‑back was observed over the past week due to cautious market sentiment.
TRX Price History and Performance
Over the years, TRON has progressed steadily, with its price closely tied to market cycles and network milestones. Since its lowest point, the token has accumulated a gain of more than 15 000 %:
- 2017‑2018 Issuance Phase: Entered the market during the crypto boom, quickly climbing to about $0.30 in early 2028 before retreating amid a broader market correction.
- 2019‑2021 Expansion Stage: Growth in DeFi activity and stable‑coin usage helped TRX stabilize and climb gradually, peaking around $0.16 in 2021.
- 2022 Bear Market: Experienced a decline during the global sell‑off, yet demonstrated greater resilience than many comparable tokens.
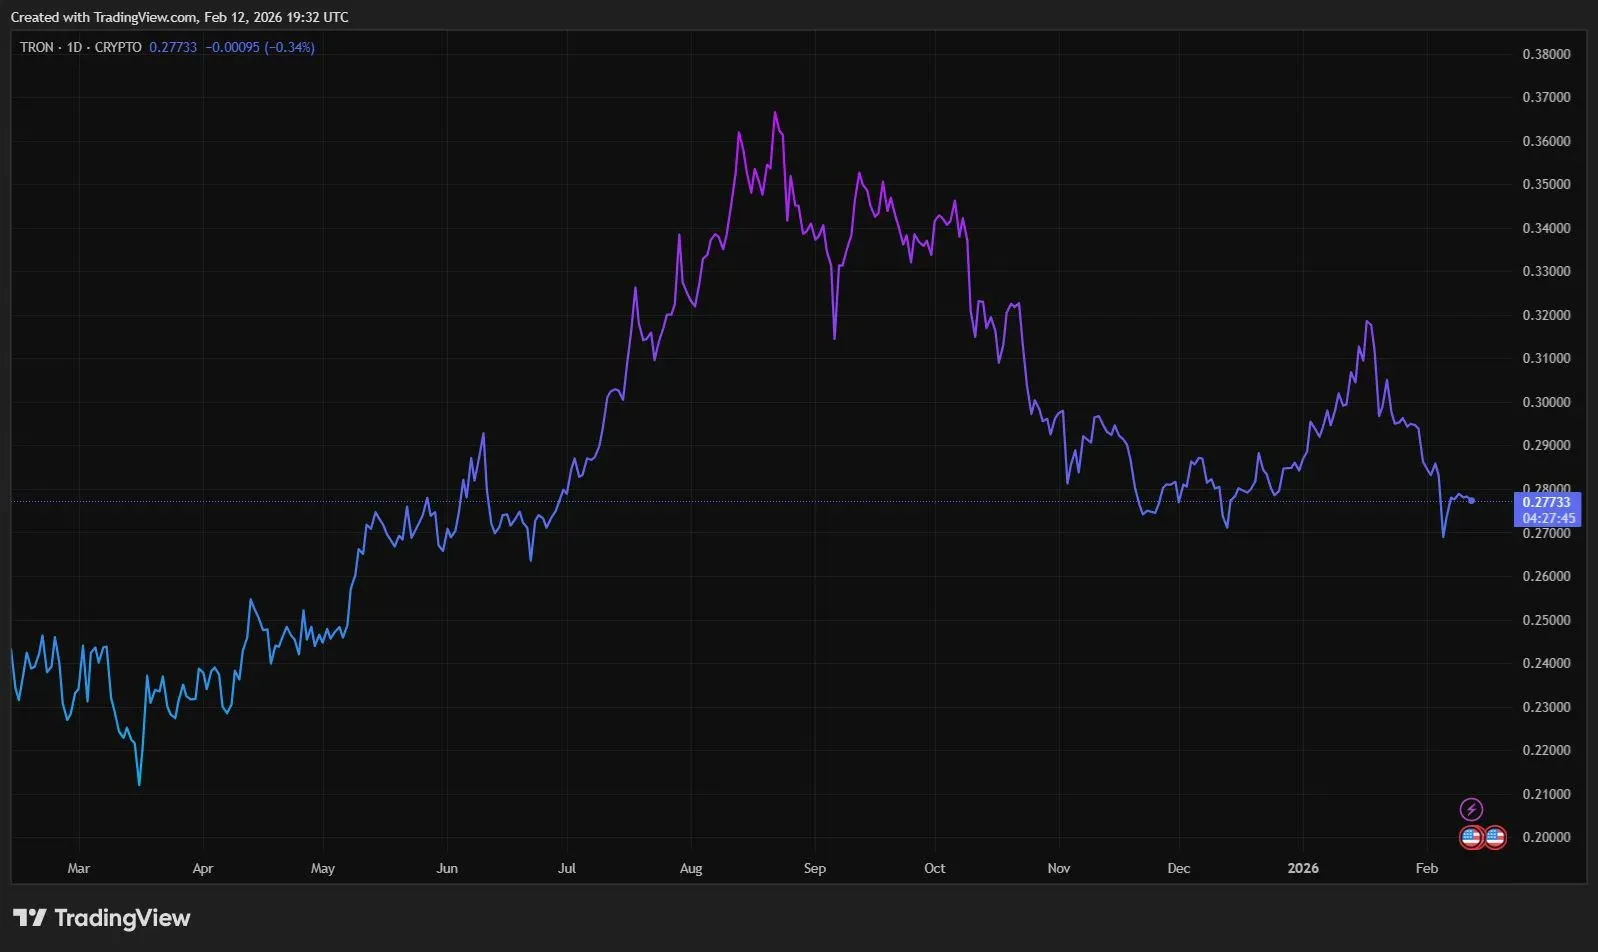
- 2023‑2025 Recovery: Strengthened network activity and increased stable‑coin transfers lifted TRX back into the $0.30‑$0.35 range.
- 2026 Current Price: At the time of writing, TRX trades near $0.278, up 1.50 % over the previous 24 hours.
Overall, TRON’s growth is slow and steady, driven primarily by user adoption and ecosystem strength rather than short‑term speculation.
TRON (TRX) Technical Analysis
Short‑term technical indicators show balanced momentum, with no pronounced bullish or bearish pressure. TRX is holding key support levels but faces moderate resistance at current price levels, making it a candidate for observation during a consolidation phase.
Moving Averages
- 50‑day MA: $0.29
- 200‑day MA: $0.31
TRX is presently below both major averages, indicating a consolidation pattern. A sustained break above the 200‑day MA would signal a shift to bullish momentum; failure to do so could keep the token trading within a narrow range.
Relative Strength Index (RSI)
- Daily RSI: 38‑41
This range reflects a neutral stance—neither overbought nor oversold—suggesting that selling pressure may be easing and that buying interest could trigger a rebound.
Critical Price Levels
- Trading Range (short‑term speculation): $0.27‑$0.29
- Key Pivot: $0.275; staying above this supports short‑term balance, while a break below could intensify downside pressure.
- Immediate Resistance: $0.28‑$0.29, a breach of which may launch the next upward wave.
Support Levels
| Level | Price (USD) |
|---|---|
| S1 | 0.275 |
| S2 | 0.272 |
| S3 | 0.271 |
| S4 | 0.269 |
| S5 | 0.260 |
Resistance Levels
| Level | Price (USD) |
|---|---|
| R1 | 0.280 |
| R2 | 0.281 |
| R3 | 0.284 |
| R4 | 0.290 |
| R5 | 0.300 |
TRON (TRX) 2026 Price Forecast
| Month | Low | Avg | High | Expected Return |
|---|---|---|---|---|
| Jan | 0.27 | 0.29 | 0.31 | 4 % |
| Feb | 0.28 | 0.30 | 0.32 | 7 % |
| Mar | 0.29 | 0.31 | 0.33 | 1 % |
| Apr | 0.30 | 0.32 | 0.34 | 14 % |
| May | 0.31 | 0.33 | 0.35 | 18 % |
| Jun | 0.32 | 0.34 | 0.36 | 21 % |
| Jul | 0.33 | 0.35 | 0.37 | 25 % |
| Aug | 0.34 | 0.36 | 0.38 | 29 % |
| Sep | 0.35 | 0.37 | 0.39 | 32 % |
| Oct | 0.36 | 0.38 | 0.40 | 36 % |
| Nov | 0.37 | 0.39 | 0.41 | 39 % |
| Dec | 0.38 | 0.40 | 0.42 | 43 % |
TRX 2027 Price Forecast
| Month | Low | Avg | High | Expected Return |
|---|---|---|---|---|
| Jan | 0.39 | 0.41 | 0.43 | 46 % |
| Feb | 0.40 | 0.42 | 0.44 | 50 % |
| Mar | 0.41 | 0.43 | 0.45 | 54 % |
| Apr | 0.42 | 0.44 | 0.46 | 57 % |
| May | 0.43 | 0.45 | 0.47 | 61 % |
| Jun | 0.44 | 0.46 | 0.48 | 64 % |
| Jul | 0.45 | 0.47 | 0.49 | 68 % |
| Aug | 0.46 | 0.48 | 0.50 | 71 % |
| Sep | 0.47 | 0.49 | 0.51 | 75 % |
| Oct | 0.48 | 0.50 | 0.52 | 79 % |
| Nov | 0.49 | 0.51 | 0.53 | 82 % |
| Dec | 0.50 | 0.52 | 0.54 | 86 % |
TRX 2028 Price Forecast
| Month | Low | Avg | High | Expected Return |
|---|---|---|---|---|
| Jan | 0.51 | 0.53 | 0.55 | 89 % |
| Feb | 0.52 | 0.54 | 0.56 | 93 % |
| Mar | 0.53 | 0.55 | 0.57 | 96 % |
| Apr | 0.54 | 0.56 | 0.58 | 100 % |
| May | 0.55 | 0.57 | 0.59 | 104 % |
| Jun | 0.56 | 0.58 | 0.60 | 107 % |
| Jul | 0.57 | 0.59 | 0.61 | 111 % |
| Aug | 0.58 | 0.60 | 0.62 | 114 % |
| Sep | 0.59 | 0.61 | 0.63 | 118 % |
| Oct | 0.60 | 0.62 | 0.64 | 121 % |
| Nov | 0.61 | 0.63 | 0.65 | 125 % |
| Dec | 0.62 | 0.64 | 0.66 | 129 % |
Long‑Term Outlook: 2026‑2030 Consolidated Forecast
| Year | Low | Avg | High | Potential Return |
|---|---|---|---|---|
| 2026 | 0.27 | 0.35 | 0.42 | 25 % |
| 2027 | 0.39 | 0.46 | 0.54 | 64 % |
| 2028 | 0.51 | 0.58 | 0.66 | 107 % |
| 2029 | 0.60 | 0.68 | 0.75 | 143 % |
| 2030 | 0.65 | 0.75 | 0.85 | 168 % |
Key Drivers Behind TRX Price Movements
- Stable‑coin demand: TRON processes a large volume of USDT and other stable‑coin transfers; each transaction consumes a small amount of TRX, creating a steady baseline demand.
- Token‑burn mechanism: A portion of transaction fees is permanently removed from circulation, tightening supply over time and potentially exerting upward pressure.
- Network upgrades: Enhancements that boost throughput and lower costs can strengthen user confidence and increase transaction activity.
- Ecosystem partnerships: New business collaborations, DeFi platforms, and NFT projects expand real‑world use cases, raising expectations for token value.
- Regulatory environment: Government policies and regulatory developments can swiftly affect investor sentiment, leading to short‑term volatility.
- Overall market sentiment: During bullish phases of the broader crypto market, TRX typically moves in tandem; large‑holder (whale) movements can also trigger short‑term swings.
- Global macroeconomics: Interest rates, inflation, and liquidity conditions influence the amount of capital flowing into digital assets; economic uncertainty may dampen price growth.
Note for U.S. users: While many global exchanges list TRX (e.g., Binance, OKX, Kraken, KuCoin, Coinbase), U.S. residents should use Binance.US or other regulated platforms that support TRX trading.
Tax disclaimer: Crypto‑related gains may be taxable in your jurisdiction. Consult a qualified tax professional to understand your obligations under local law.
Conclusion
TRON (TRX) holds a solid position in the crypto space, backed by high‑volume transactions, stable‑coin support, and an ever‑expanding DeFi and NFT ecosystem that delivers tangible utility. Its price is closely linked to network activity and overall market sentiment, with short‑term fluctuations often driven by regulatory or macro‑economic factors. Over the longer horizon, growing user numbers, continuous upgrades, and rising demand provide a foundation for steady appreciation. Volatility will persist, but the underlying practical use cases lay a robust groundwork for future development.
Frequently Asked Questions
Will TRX rise in 2026?
If market acceptance and sentiment stay positive, TRX could see modest upside. Analysts forecast a 2026 price band of $0.27‑$0.42, averaging around $0.35, with stability remaining its core strength.
Can TRON (TRX) break the $10 barrier?
Given the current price near $0.30 and the token’s total supply, reaching $10 in the short term is highly unlikely. Achieving such a level would require massive user growth, strong demand, and a sustained bull market.
What is the estimated value of TRON five years from now?
Projections suggest that by 2031 the average price of TRX could sit between $0.80‑$1.00, with an optimistic upside to $1.20. This assumes continued network expansion and a favorable financial environment; actual returns will depend on the health of the broader crypto market.
What are the main factors influencing TRX price?
Price dynamics stem from a combination of network activity, stable‑coin transaction volume, token‑burn effects, partnership developments, and overall market trends. Regulatory news can also cause short‑term swings, so monitoring these variables helps assess potential price movements.
What are the primary risks to the TRX price forecast?
TRX is listed on major exchanges such as Binance, OKX, Kraken, KuCoin, and Coinbase. To protect assets, it is advisable to store TRON tokens in a hardware wallet or a reputable software wallet that supports the network, and to enable two‑factor authentication. Additionally, regulatory changes, macro‑economic shifts, and market sentiment can introduce volatility.
---
This completes the full translation of “TRON (TRX) Coin 2026‑2030 Price Forecast: Historical Performance and Market Position Analysis.” For more in‑depth TRX outlooks, search for previous Bitaigen (比特根) articles or continue exploring related pieces below. Thank you for your continued interest and support!
Related Reading
- Bitcoin Price Forecast: $68K Consolidation Sets Up Next Move
- USOR Token Surge Amid US‑Iran Tensions: Oil‑Linked Asset Review
💡 Register on Binance with referral code B2345 for the maximum trading fee discount. See Binance complete guide.
⚠️ Risk Disclaimer: Crypto prices are highly volatile. This is not investment advice.


