
 Bitaigen Research
 We systematically review Bitcoin’s two major on‑chain metrics, MVRV and MVRV‑Z, in this article, explaining their calculation logic and market significance, and demonstrating how to use these signals to spot potential bottoms. With charts and case studies, we aim to help investors capture more reliable entry points amid volatility and improve the scientific basis of their decisions.
What Is Bitcoin MVRV? How Can the MVRV‑Z Indicator Help Spot Bottoms?
Bitcoin MVRV is the ratio of market value to realized market value; the MVRV‑Z score measures its relative extremeness, assisting in bottom‑finding and formulating entry strategies.
The MVRV metric is a long‑term tool for assessing BTC valuation and is suitable as a left‑side (early) bottom‑fishing reference.

What Is the MVRV Metric?
The MVRV metric was introduced in 2018 by on‑chain analysts Murad Mahmudov and David Puell to evaluate Bitcoin’s overall valuation level. Higher values suggest the market may be overheated, while lower values indicate subdued sentiment and are often used to capture bottom‑fishing opportunities.
How Is the MVRV Metric Calculated?
MVRV = MV / RV
- MV (Market Value, circulating market cap)
MV = Current Bitcoin price × circulating supply, which is equivalent to Bitcoin’s market capitalization.
- RV (Realized Value, realized market cap)
RV = Price at which each Bitcoin last moved on‑chain × circulating supply. This price reflects the average purchase cost across all coins.
Interpretation
- MVRV > 1 → Market value exceeds average cost, indicating overall profit and potential sell‑off pressure.
- MVRV < 1 → Market value is below average cost, indicating overall loss and a possible approach to a bottom.
What Is the MVRV‑Z Metric? How It Differs From the Raw MVRV
MVRV‑Z = (MV – RV) / Standard deviation of MV
MVRV‑Z standardizes the raw MVRV by expressing it in terms of its historical volatility, thereby reducing short‑term price noise and making it more suitable for identifying long‑term over‑ or undervaluation.
Empirical thresholds
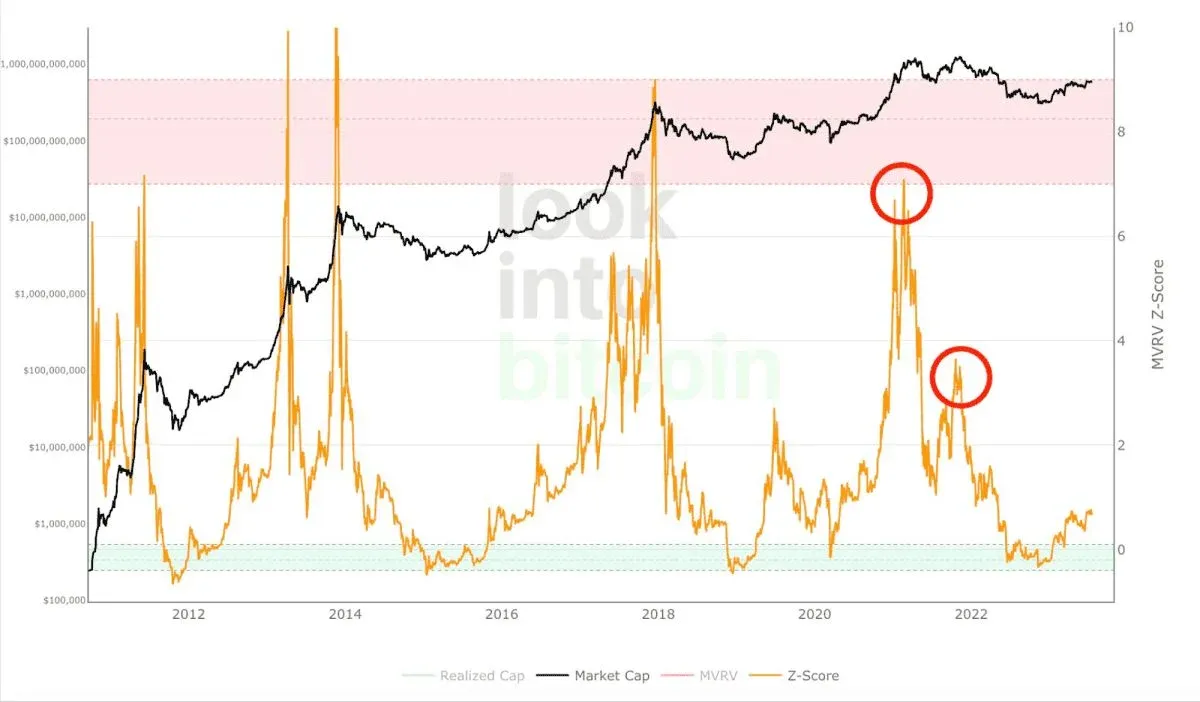
- MVRV‑Z > 7 → Market is severely overvalued; caution is warranted.
- MVRV‑Z < 0 → Market is undervalued, potentially presenting buying opportunities.
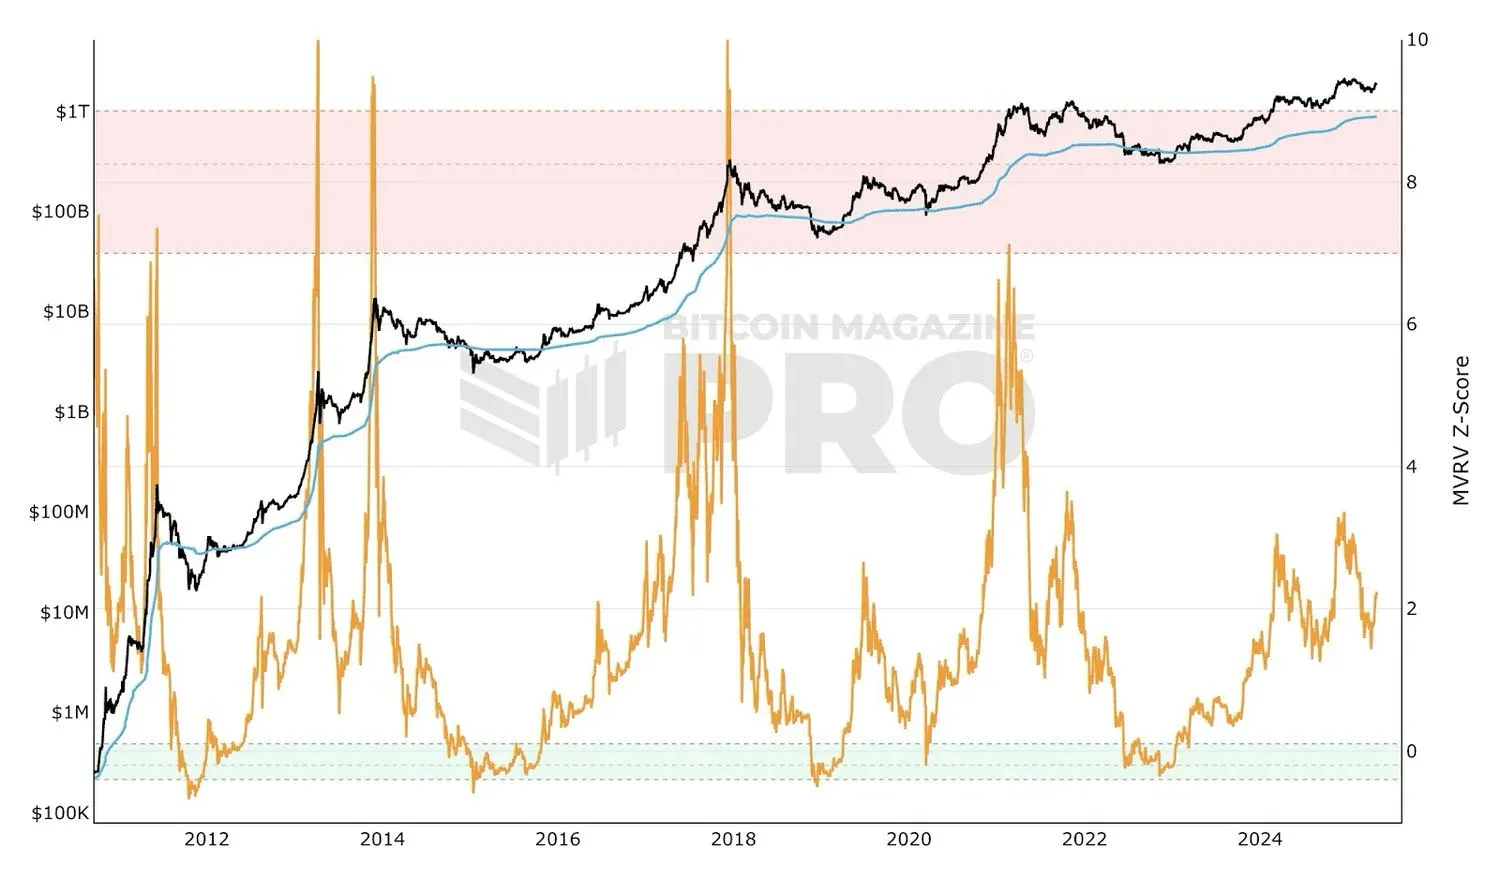
Where to view the metric
- LookIntoBitcoin
- Finance M² (M‑Square)
How to Use MVRV‑Z
- Set a trigger threshold, such as entering a staggered position when MVRV‑Z falls below 1 or turns negative.
- The stricter the threshold, the larger the safety margin, but the higher the chance of missing part of a subsequent rally.
- At present the indicator is only applicable to Bitcoin because its historical data set is relatively complete and its holder distribution is sufficiently broad.
How to Bottom‑Fish With the MVRV‑Z Indicator?
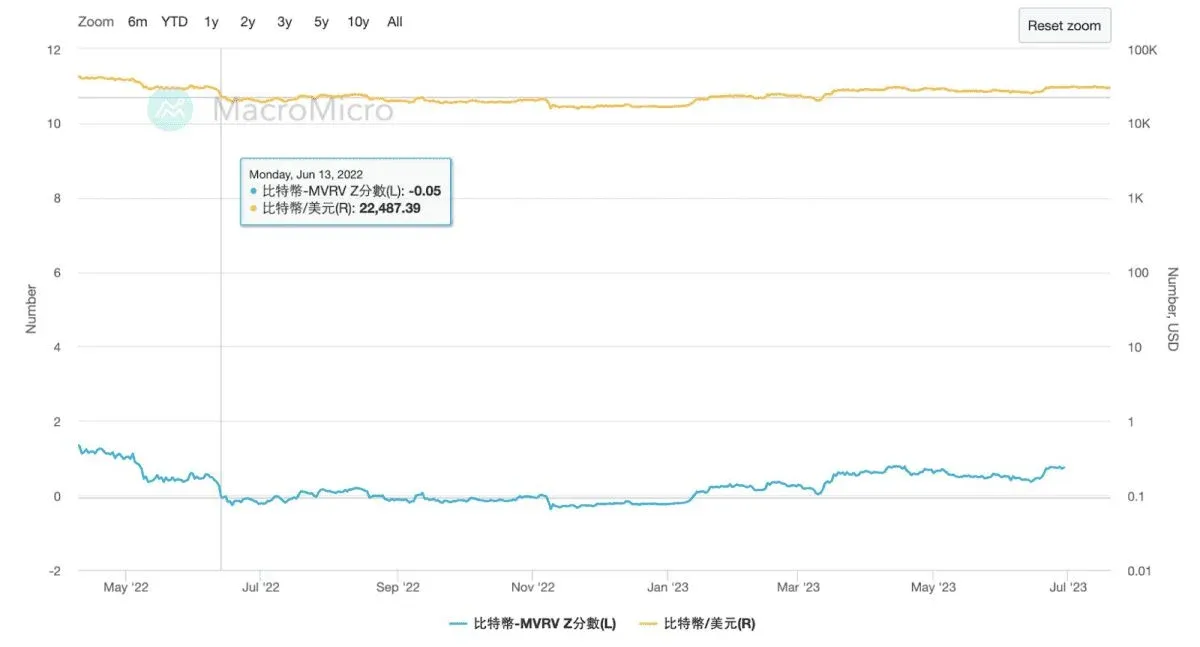
Back‑testing shows that periods when MVRV‑Z is negative often coincide with Bitcoin’s macro‑cycle bottoms, providing a strong bottom‑fishing signal. Below are several representative cases:
| Period | Date MVRV‑Z Turned Negative | Maximum Unrealized Loss | Subsequent Peak Return |
|---|---|---|---|
| 2014 Bear Market | October 2014 | ≈ 53 % | 180 % (to the 2016 “small bull”) / 7 000 % (to the 2017 bull) |
| 2018 Bear Market | November 2018 | ≈ 28 % | 250 % (to the 2019 “small bull”) |
| 2020‑03‑12 Crash | Negative for only 7 days | — | ≈ 1 300 % (to the 2021 bull) |
| 2022 Bear Market | June 2022 | ≈ 31 % | ≈ 480 % (held to December 2024) |
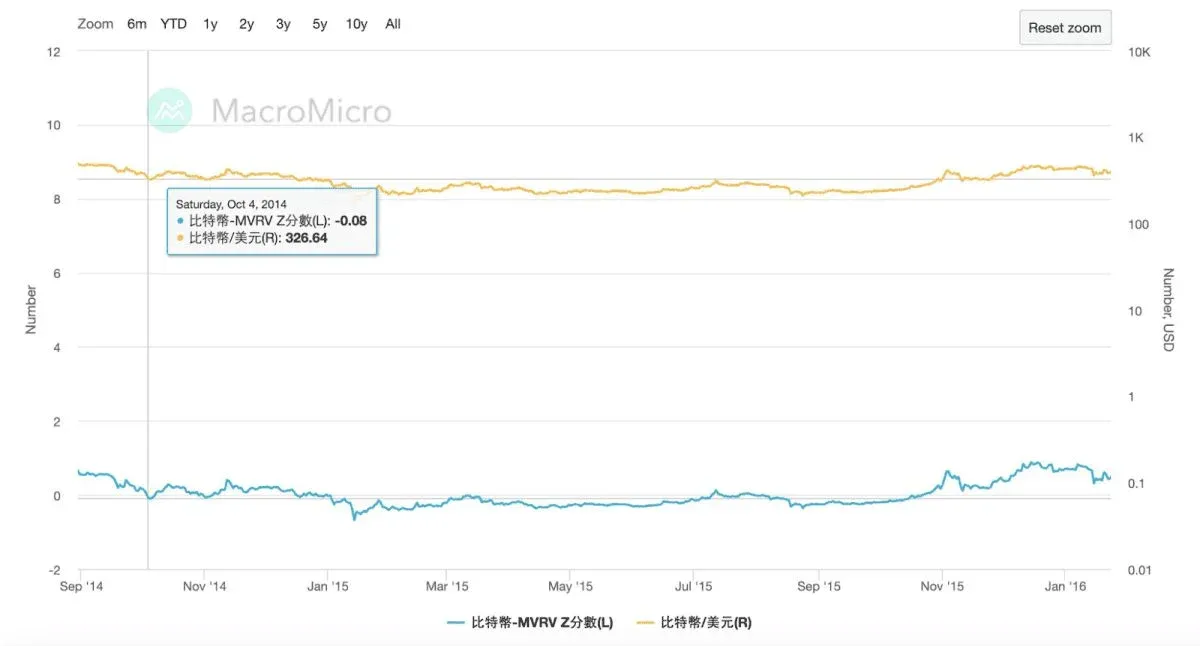
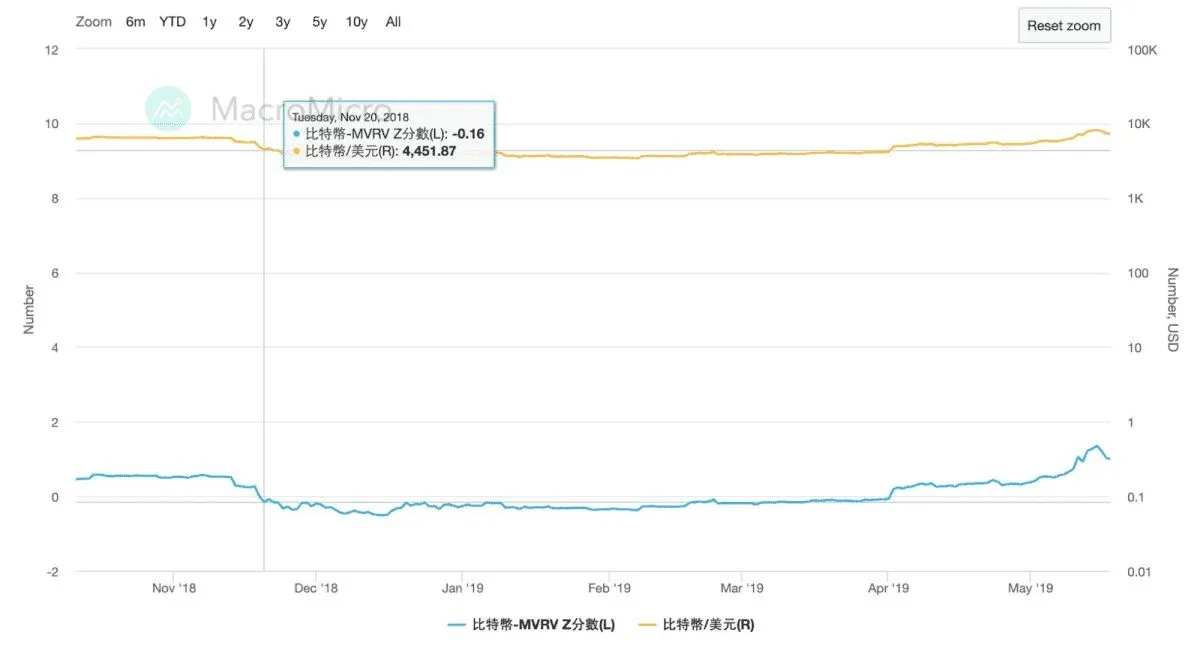
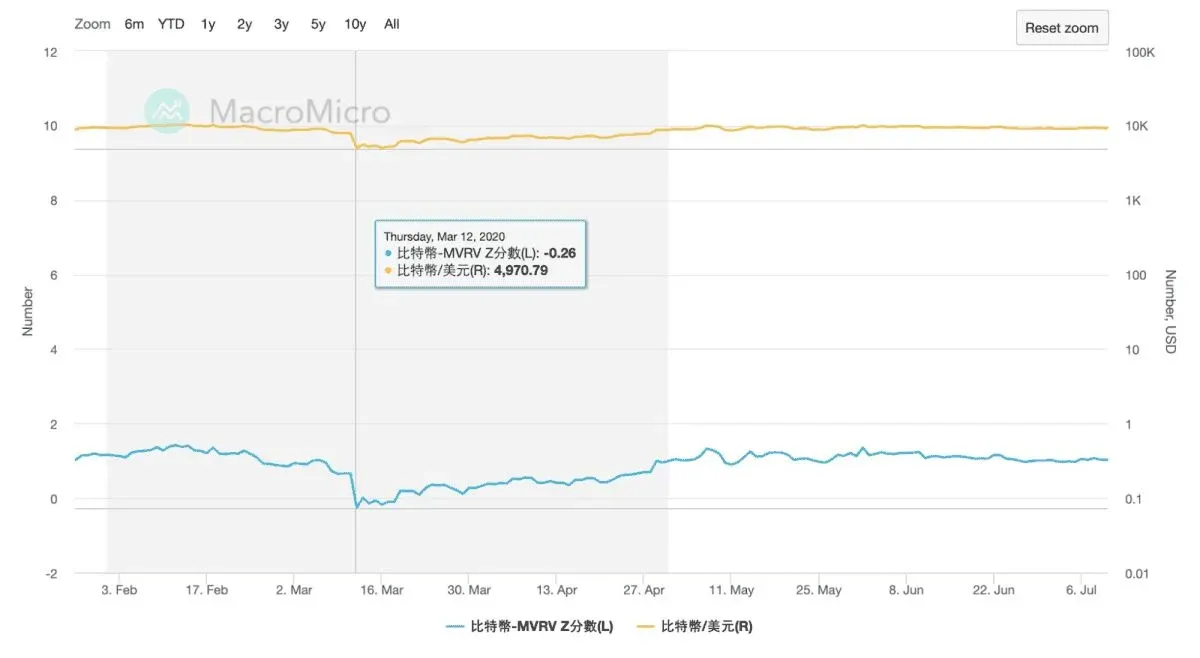
Advantages of the MVRV‑Z Indicator
- Low operational frequency – Negative readings usually correspond to macro‑cycle bottoms, eliminating the need for daily monitoring.
- Contrarian – Negative zones appear alongside extreme pessimism; an objective metric helps investors buy when sentiment is at its worst.
- Simple and intuitive – The calculation is straightforward, allowing non‑technical participants to adopt it quickly.
Limitations and Common Misconceptions of MVRV‑Z
| Limitation | Explanation |
|---|---|
| Requires phased entry | After the metric turns negative, prices may keep falling; committing the entire capital at once carries high risk, so staggered purchases are advisable. |
| Cannot forecast bear‑market length | Negative periods can range from a few weeks to a year, making it difficult to predict when the downturn will end. |
| Weak at predicting bull‑market tops | The indicator shines at bottoms; identifying peaks still requires complementary tools. |
| Relatively limited historical sample | Introduced in 2018, it has captured several bottoms but the total testing horizon remains modest. |
Practical Recommendations
- Treat MVRV‑Z as a reference tool and combine it with other on‑chain data, macroeconomic conditions, and technical indicators for a holistic view.
- Monitor the frequency and depth of negative‑value episodes, and adjust position sizing accordingly.
This article introduced the concept of Bitcoin MVRV, the calculation and application of MVRV‑Z, and their performance across historical market cycles. For further MVRV analysis, search for prior Bitaigen (比特根) articles or continue browsing the related content below. We appreciate your ongoing interest and support for Bitaigen (比特根)!
Related Reading
- BIP-110: Enhancing Bitcoin Node Access & Block Space
- Bitcoin Price Decline Slows Yet Bear Market Persists
- Bitcoin 2026‑2030 Price Forecast: Trends, Factors & Outlook
💡 Register on Binance with referral code B2345 for the maximum trading fee discount. See Binance complete guide.



