
 Bitaigen Research
 Key Points
- In‑Depth Multi‑timeframe HYPE Structure Analysis: Primary monitoring on the weekly chart (see Part 1 for details).
- BTC Short‑Term Strategy Back‑test: Last week we strictly followed the pre‑planned short‑position plan (1× leverage), achieving 6.41 % profit (see Table 1).
- BTC Mid‑Term Strategy Review: Maintained a short position opened at $89,000 until the closing price of $65,971, resulting in a cumulative gain of approximately 25.88 %, with a peak profit of 32.58 %.
- Short‑Term View Confirmation: Bitcoin continues to oscillate within a weak range, and the price action aligns closely with our expectations.
- Outlook for the Coming Week and Mid‑/Short‑Term Trade Recommendations.
The sections below will sequentially revisit market assessment, strategy execution, and the concrete trade details.

In this report we dissect Bitcoin’s recent post‑overshoot technical structure, combine the multi‑timeframe HYPE model with live back‑testing, showcase the performance of our short‑position strategy, and look ahead to next week’s range‑bound trading and key operational nodes. The full text breaks down market judgment and trade specifics to help readers capture mid‑ and short‑term opportunities; it is worth a careful read.
4. Weekly Market Forecast (03 Sep – 15 Mar)
1. Formation of an Upward Pivot (Based on the post‑Feb 6 low rally)
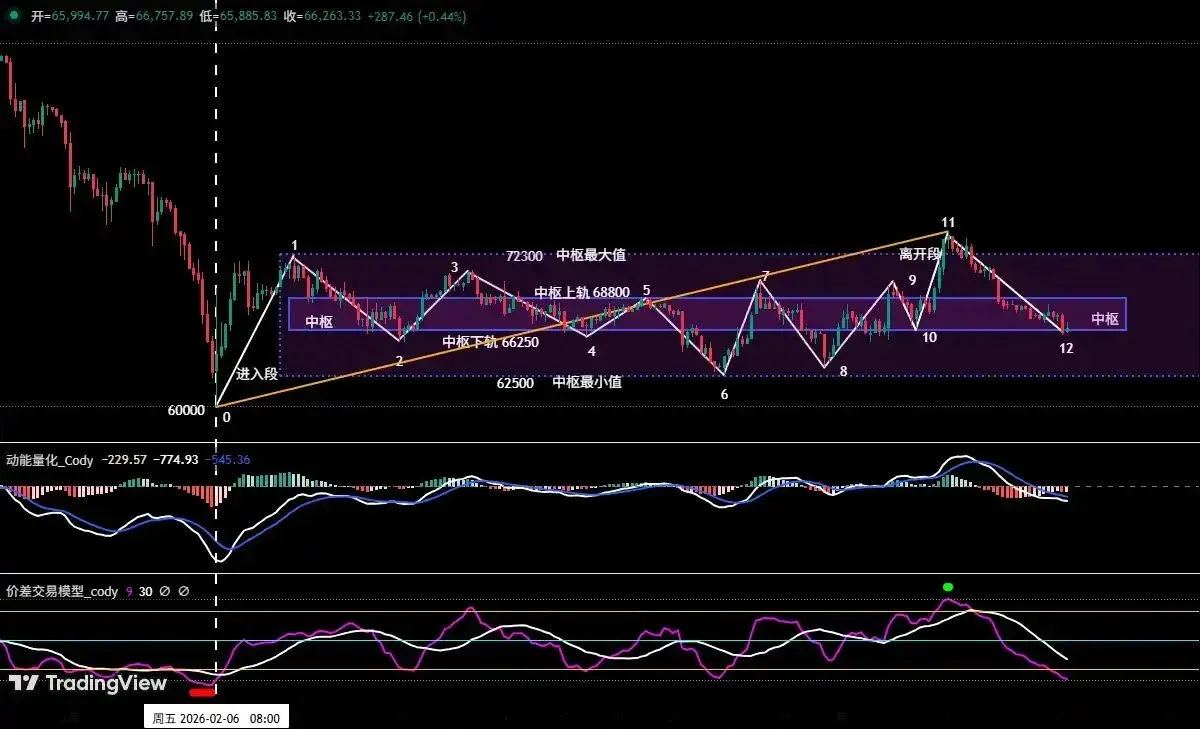
Figure 6: Bitcoin 4‑hour candlesticks
The 4‑hour chart shows that an upward pivot zone has begun to take shape. The upper boundary sits around $68,800, the lower boundary near $66,250; the next resistance level is roughly $72,300, while the nearest support is around $62,500.
2. Is the C‑2 Wave Overshoot Rebound Nearing Its End?
- We continue to adhere to the earlier framework: the rally that started from the Feb 6 low (≈ $60,000) is interpreted as the C‑2 wave’s overshoot rebound, after which we expect a transition into a C‑3 correction.
- Bottom warning: The price‑difference trading model emitted a red bottom signal at endpoint 0 (Feb 6), accurately capturing the start of the C‑2 wave.
- Top warning: A recent green top signal at endpoint 11 suggests that the momentum of this rebound may already be fading.
3. Core Judgment for the Week
Range‑bound trading remains the dominant theme, and the C‑2 wave rebound appears to be approaching its conclusion. From an operational standpoint we recommend gradual profit‑taking on rallies to keep risk under control.
4. Key Resistance Levels
- Zone 1: $72,300 – $74,500 (historical concentration of token holdings).
- Zone 2: $79,500 – $80,600 (near the low observed in November 2025).
5. Key Support Levels
- First support: $65,000 (previously significant support zone).
- Second support: $60,000 – $62,500 (the Feb 6 low).
- Third support: $57,400.
6. Special Reminder
- Set a stop‑loss immediately after opening a position.
- When profit reaches 1 %, move the stop‑loss up to the entry price.
- When profit reaches 2 %, shift the stop‑loss up to the level where you are already 1 % in profit.
- Thereafter, each time the profit increases by another 1 %, raise the stop‑loss by the same 1 % amount, thereby implementing a dynamic break‑even strategy.
*Note: Cryptocurrency gains may be taxable in your jurisdiction; consult a tax professional for guidance.*
---
2. Review of Bitcoin’s Strategy Execution Last Week (02 Mar – 08 Mar)
1. Short‑Term Strategy Execution (Table 1)
Using signals from our proprietary price‑difference trading model and momentum quant model, we placed a short position (1× leverage) that ultimately yielded a 6.41 % gain.

Table 1 (omitted for brevity)
Highlights of the Trade Process (see Figure 3)
- Entry: Around the $74,500 resistance zone, the price‑difference model issued a top‑warning (green dot in the figure). Combined with a short‑signal resonance from both models, we opened a 30 % short at $72,760.
- Stop‑loss: Initially set just above $75,500.
- Exit: As price retreated toward $68,000, the price‑difference model generated a bottom‑warning (red dot). We closed the entire position at $68,095.
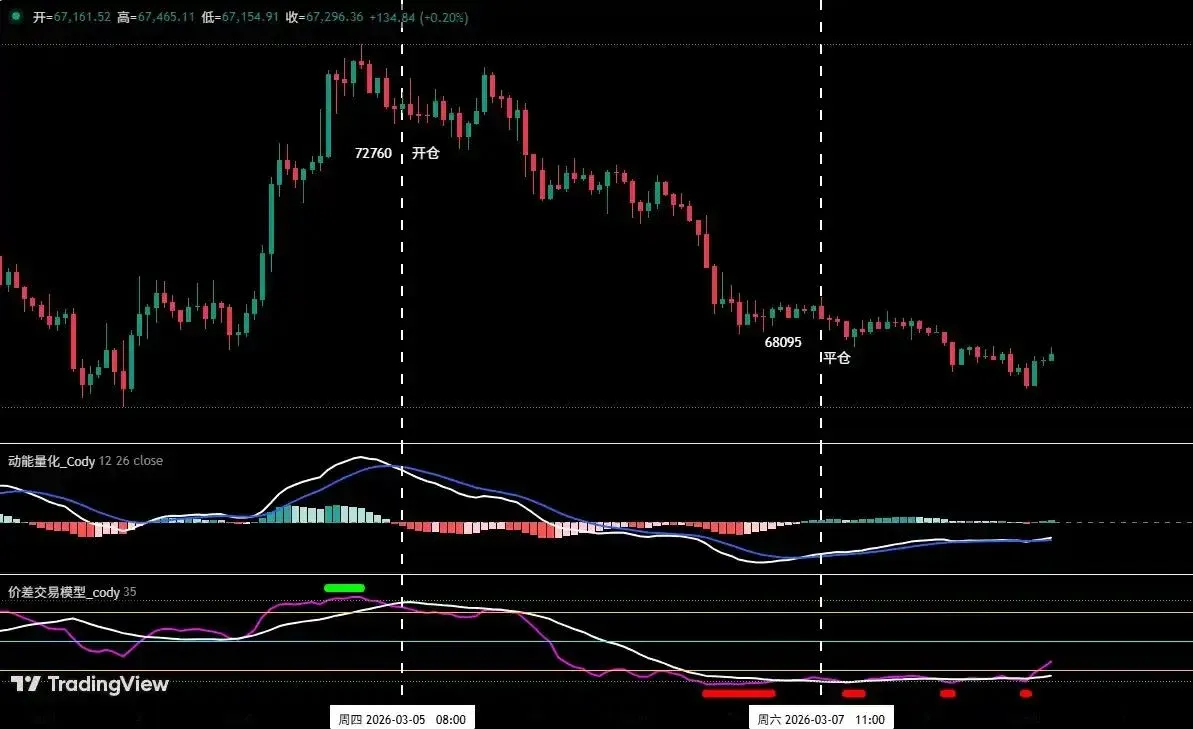
Figure 3: Short‑term trade illustration
2. Mid‑Term Strategy Review
We kept a 60 % short position originally opened on Jan 28 at $89,000. By the close of last week at $65,971, the cumulative profit stood at roughly 25.88 %, with a peak of 32.58 % during the holding period.
---
3. Technical Indicator Analysis for Bitcoin
1. Weekly Perspective (Figure 4)
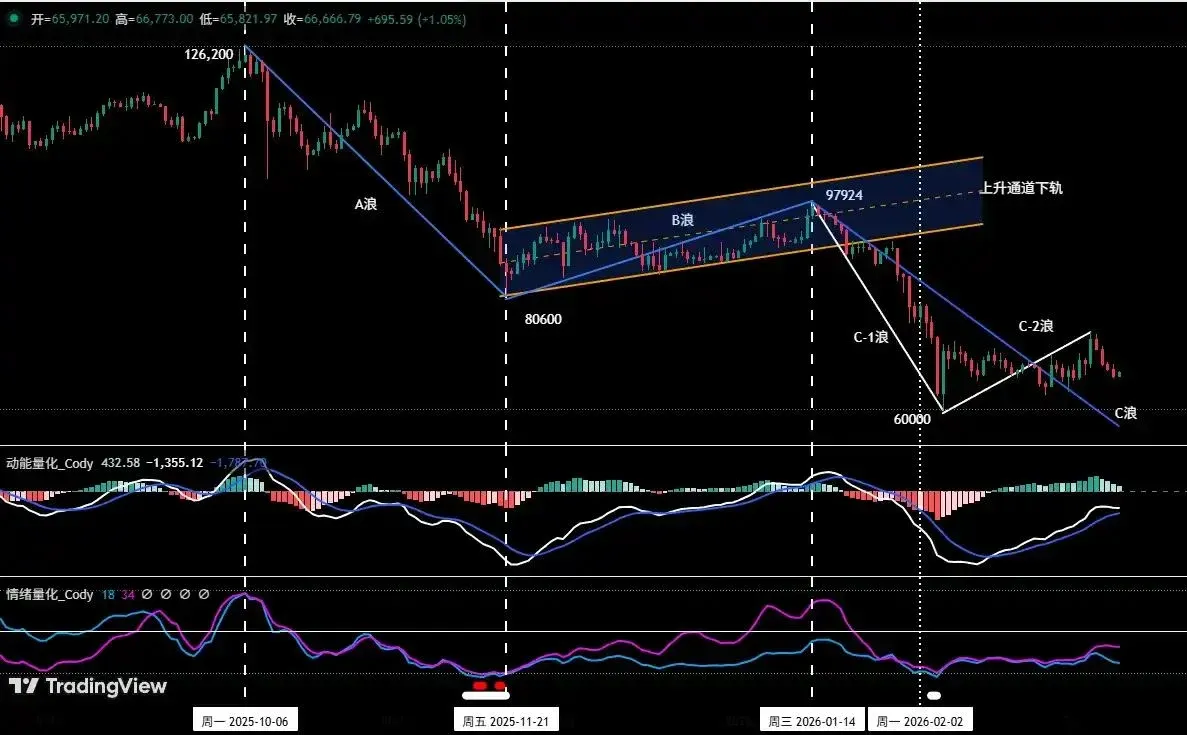
Figure 4: Bitcoin weekly candlesticks (Momentum Quant + Sentiment Quant)
- Momentum Quant: The momentum line trends downward, and the negative‑energy bars are gradually narrowing, with no visible divergence.
- Sentiment Quant: Blue line reads 23, yellow line 11—both indicating zero‑strength sentiment, with no obvious emotional swings.
- Numerical Monitoring: Moving averages are in a bearish arrangement; a recent small bullish candle with a long upper wick rose 0.3 %, but a bottom signal has not yet materialized.
Overall Assessment: All three models point to a continued weekly bearish bias; after a consolidation phase the market is more likely to probe further lows.
2. Daily Perspective (Figure 5)
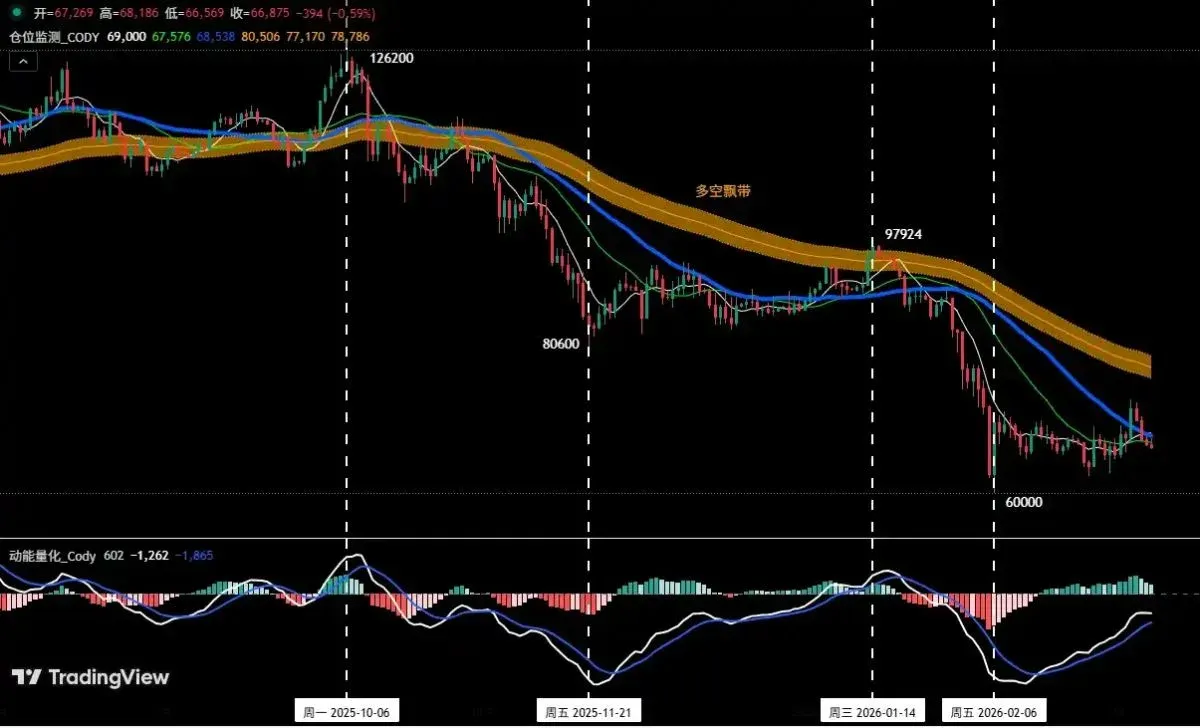
- Momentum Quant: Last week displayed a “rise‑then‑suppression” pattern. The momentum line moved upward while staying below the zero axis, and positive bars appeared erratically.
- Sentiment Quant: Post‑market blue line 19, purple line 35, both still at zero‑strength, indicating weak sentiment.
Overall Assessment: The daily bearish structure largely persists. The current move can be characterized as an overshoot rebound, but buying pressure is insufficient, sentiment remains cautious, and participation is low, limiting the rebound’s strength and durability.
---
5. Trade Strategy for the Coming Week (03 Sep – 15 Mar)
1. Mid‑Term Position Guidance (Figure 7)
Figure 7: Position‑monitoring model
The price currently sits below the long‑short ribbon (yellow band). We recommend retaining the 60 % short position that was opened at $89,000.
- If price breaches $74,500, consider trimming the short exposure to 40 %.
- If price climbs above the long‑short ribbon and sustains an upward trajectory, a full exit could be contemplated.
2. Short‑Term Operational Ideas (30 % of Capital)
Using 30‑minute and 60‑minute timeframes together with identified support‑resistance zones, we propose two A/B contingency plans that align with the prevailing bearish bias.
Plan A: Rebound Stalled – Short on the Rally
- Entry: When price rebounds into the $72,300 – $74,500 band and a resistance signal appears, and the model flashes a top‑warning, open a 30 % short.
- Stop‑loss: Place just above $75,500.
- Exit: Reduce the position gradually as price falls to a key support and the model issues a bottom‑warning.
Plan B: Break‑down of the Pivot Followed by Unsteady Pull‑back – Trend‑following Short
- Entry: After price breaks below the lower pivot boundary at $66,250 and then attempts a pull‑back that fails to hold, with a top‑warning from the model, open a 30 % short.
- Stop‑loss: Set just above $67,500.
- Exit: Close progressively when price reaches the support zone and a bottom‑signal emerges from the model.
*For U.S. residents, trades on Binance must be executed through Binance.US rather than the global Binance platform. International users can use SEPA or SWIFT for fiat deposits and withdrawals.*
---
1. HYPE Multi‑timeframe Structure and Short‑Term Recap
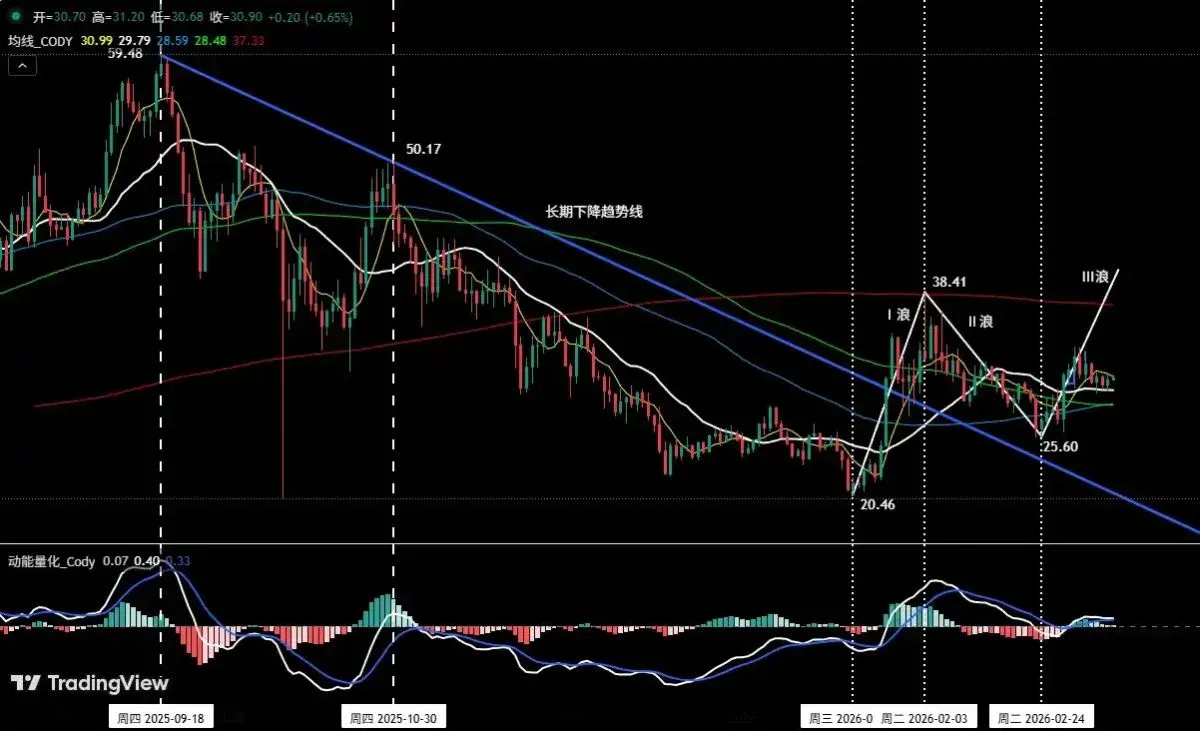
Large‑Scale Structure (Figure 1)
- Wave I (Impulse): Low of $20.46 on Jan 21 → High of $38.41 on Feb 3, a rise of 87.73 %.
- Wave II (Correction): High of $38.41 on Feb 3 → Low of $25.60 on Feb 24, a decline of 33.35 %.
- Wave III (Potential Impulse): From the Feb 24 low of $25.60 to the present, 13 days have elapsed, with a peak gain of 31.5 %.
Moving‑average analysis shows that the up‑trend since Feb 24 has broken through multiple moving‑average resistances; the price is now testing the 21‑day moving average as support. Volume exhibits a “expanding on the rise, contracting on the pull‑back” pattern, indicating healthy price‑volume synergy. The momentum line remains safely above the zero axis, suggesting bullish momentum is still building.
Small‑Scale Structure (Figure 2)
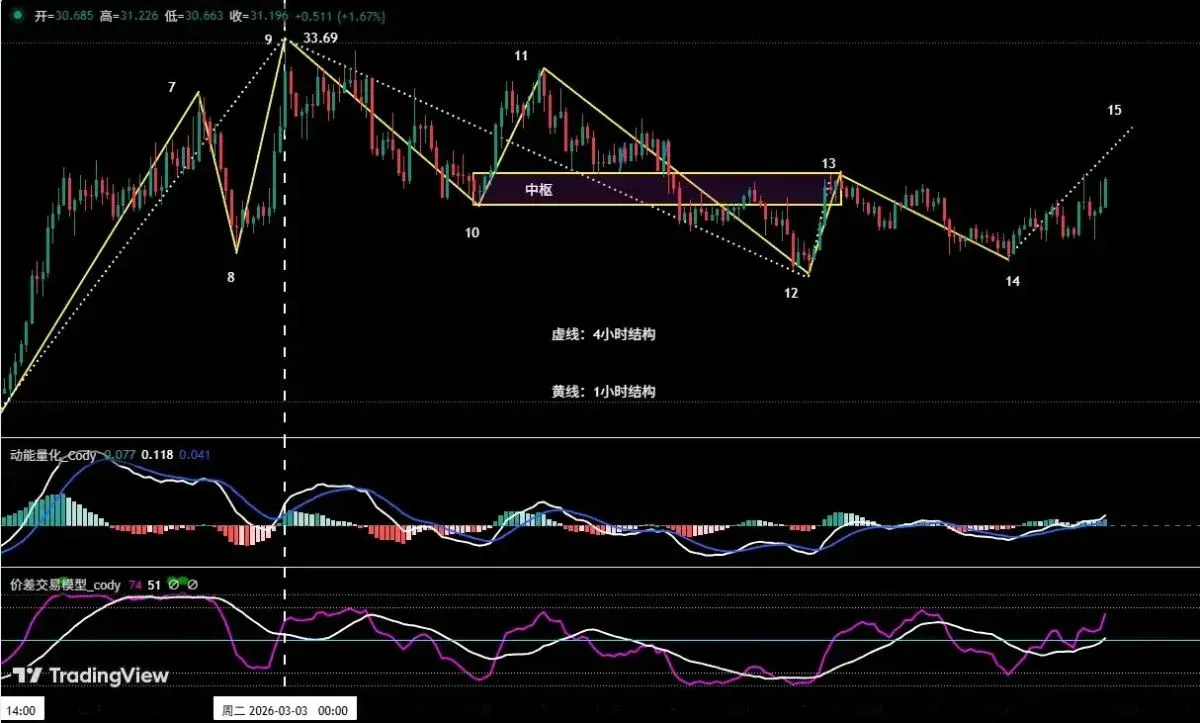
Figure 2: HYPE 1‑hour candlesticks
The rally that began at the Feb 24 low reached $33.69 on Mar 2 before entering a corrective phase. The 1‑hour chart can be divided into five segments (9‑10, 10‑11, 11‑12, 12‑13, 13‑14), with the 10‑12 segment forming a consolidation zone. A divergence signal indicates that if price stabilizes near endpoint 12 around $31.5 and then breaks above $32.75, the current correction may end, raising the probability of a subsequent rise. Conversely, a drop below $29.44 (endpoint 12) would require a reassessment of the correction’s endpoint.
HYPE Short‑Term Recap (02 Mar – 08 Mar)
Based on the daily upward bias and the hour‑level corrective structure, we refrained from opening new long positions during this interval and kept a watchful stance.
---
6. Closing Remarks
This article validates Bitcoin’s overshoot rebound scenario and stresses that the current recovery does not equate to a full trend reversal. For deeper Bitcoin price analysis, consult past Bitaigen (比特根) articles or continue reading the related sections below. Thank you for following and supporting Bitaigen (比特根)!
💡 Register on Binance with referral code B2345 for the maximum trading fee discount. See Binance complete guide.



