
 Bitaigen Research
 In this article we outline the macro backdrop of the Federal Reserve’s rate cuts and quantitative easing (QE), explain why institutional capital is re‑allocating to Bitcoin amid market volatility, and present a forward‑looking view of a post‑CPI bull market based on inflation trends. The full text helps readers discern the structural forces behind the price breakout and is worth a careful read.
Macro Trend: Fed Policy Shift and Inflation‑Driven Tailwinds
Entering 2026, the monetary policy stance of the dollar system shows a clear pivot. The Federal Reserve plans to commence rate cuts in the first quarter and pair them with quantitative easing, aiming to inject vigor into the economy and ease the still‑declining inflation pressure. By the end of 2025, core CPI had fallen to 2.6 %, significantly reducing market concerns about continued rate hikes and prompting investors to reassess allocation directions.
Against this backdrop, risk assets regain appeal, and Bitcoin’s “digital gold” narrative gains renewed attention. Historical data show that Bitcoin’s average return in the first quarter of each year is roughly 50 %, a period that often follows a corrective rebound from the previous quarter’s volatility. As central banks worldwide shift their focus from curbing inflation to fostering growth, the macro narrative surrounding Bitcoin is gradually moving from defensive to constructive.

Institutional Return: Accumulating Amid Volatility
At the close of 2025, capital flows displayed a stark divergence: in November, Bitcoin ETFs saw a net outflow of about $6.3 billion, yet the buying intensity from institutional players did not wane. MicroStrategy added roughly 11,000 BTC (around $1.1 billion) in early 2025, indicating that its long‑term commitment to digital assets is deepening.
During the same period, mid‑size holders increased their share of the total Bitcoin supply in the first quarter, signaling that this class of investors is strategically scaling up during market turbulence. The contrast between ETF withdrawals and core institutional net buying suggests that when prices dip, retail‑driven ETF capital tends to exit, while institutional investors position themselves for the next upward wave.
Short‑term holder behavior further corroborates this view: at the start of 2025, the Spent Output Profit Ratio (SOPR) for short‑term holders stayed below 1 for more than 70 consecutive days, meaning that many short‑term sellers were exiting at a loss. This selling pressure creates more cost‑effective entry points for long‑term capital and furnishes institutions with opportunities to acquire positions at lower levels.
On‑Chain Metrics: In a “Value Zone” but Still Wary of Bearish Risks
On‑chain data indicate that Bitcoin is approaching a historically referenced “value zone.” By the end of 2025, the asset experienced an overall ~6 % annual drawdown, with the fourth quarter alone plunging over 20 %, yet several on‑chain signals began to diverge.
- Indicators such as “percentage of profit‑making addresses” continued to weaken, reflecting rising sell pressure from long‑term holders.
- Conversely, valuation tools like Dynamic NVT and Bitcoin Yardstick suggest that Bitcoin may be undervalued, echoing characteristics observed at several past major bottoms.
This contradiction implies that bearish sentiment persists in the short term, but fundamental undervaluation offers institutions an asymmetric edge: downside risk appears limited while upside rebound potential remains sizable.
BTC Absolute Momentum Strategy (Long‑Only)
- Entry condition: Open a long position when the 252‑day Rate of Change (RoC) is positive and the closing price is above the 200‑day Simple Moving Average (200‑day SMA).
- Exit rules: Close the position if the close falls below the 200‑day SMA, or after 20 trading days, or when a profit target of +8 % or a stop‑loss of ‑4 % is hit.
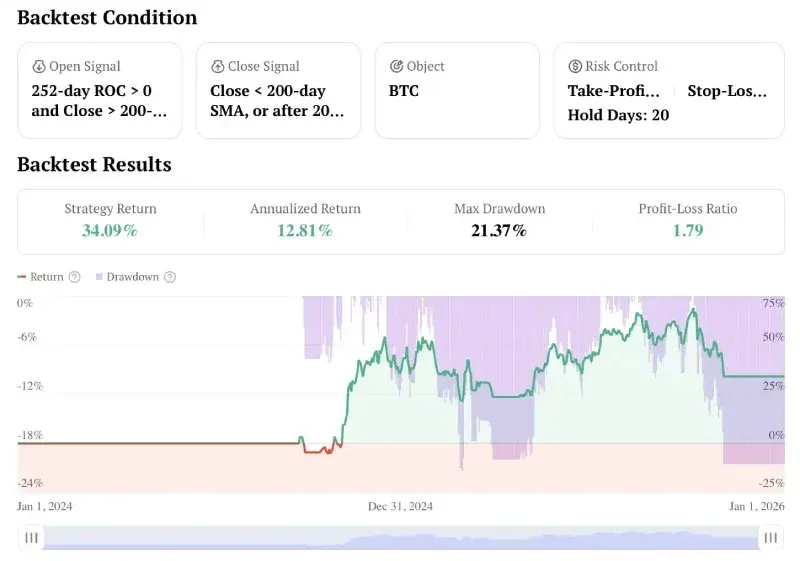
Back‑test results
- Total trades: 39
- Winning trades: 16
- Losing trades: 23
- Win rate: 41.03 %
- Average holding period: 8.26 days
- Maximum consecutive losses: 5
- Profit‑to‑loss ratio: 1.79
- Average profit per winning trade: 8.53 %
- Average loss per losing trade: 4.26 %
- Largest single‑trade profit: 16.86 %
- Largest single‑trade loss: 7.82 %
Conclusion: The 2026 Bounce Is Brewing
The confluence of macro‑level policy easing and the re‑entry of institutional capital builds a fundamentally bullish backdrop for Bitcoin in 2026. The Fed’s rate cuts and QE are expected to unleash additional liquidity, nudging capital toward alternative assets such as Bitcoin; even after the sharp volatility witnessed in Q4 2025, institutions continued to accumulate, underscoring confidence in Bitcoin’s long‑term value proposition.
For investors, the key takeaway is that Bitcoin’s upcoming “strategic rebound” is not merely a technical price correction but the result of synchronized shifts in monetary policy and institutional behavior. Aligning with both macro and institutional signals may place participants in a more advantageous position as Bitcoin settles into a new equilibrium.
*Note: U.S. investors should access crypto products through Binance.US rather than the global Binance platform. Crypto gains may be taxable in your local jurisdiction; consult a tax professional for guidance.*
---
This concludes the article. For further Bitcoin price analysis, explore past pieces from Bitaigen (比特根) or continue reading the related articles below. Thank you for following and supporting Bitaigen!
Related Reading
- Arkham Traces Massive Mt. Gox Bitcoin Moves, Market Impact
- Bitcoin Price Forecast 2026: Trends, Drivers & Charting Tips
- Bitcoin Halving Impact on Post‑Halving Prices Amid Spot ETFs
💡 Register on Binance with referral code B2345 for the maximum trading fee discount. See Binance complete guide.



