

Optimism (OP) demonstrates its commitment to innovation through support for Layer‑3 solutions. These solutions enable developers to build decentralized applications (dApps) on top of Layer‑2 chains, helping to expand the Optimism Superchain ecosystem.
The platform has introduced a series of measures—such as a custom gas token and a Plasma mode—aimed at lowering onboarding and operational costs, making the network more friendly to new users and developers. Market participants are closely watching OP’s price movements and growth trajectory, wondering whether Optimism can break the $10 barrier in the near future.
Below is a detailed OP price forecast covering 2026‑2032.
We analyze OP’s development potential from three angles—technology roadmap, ecosystem layout, and market sentiment—and combine these insights with broader industry trends to provide a reasoned outlook on OP’s price over the coming years. If you want to know whether OP might breach key price levels, keep reading the full analysis.
Overview
Cryptocurrency Optimistic Token OP
- Price: $0.1974
- Market cap: $416.37 million
- 24‑hour volume: $85.22 million
- Circulating supply: 2.116 billion OP
- All‑time high: $4.85 (6 Mar 2024)
- All‑time low: $0.2519 (26 Dec 2025)
- 24‑hour high: $0.1997
- 24‑hour low: $0.1887
Optimistic Price Forecast: Technical Analysis
| Indicator | Value |
|-----------|-------|
| 30‑day volatility | 15.44 % (very high) |
| 50‑day moving average | $0.2924 |
| 14‑day Relative Strength Index (RSI) | 30.36 (neutral) |
| Fear & Greed Index | 6 (extreme fear) |
| 10/30 Green‑Day Ratio | 33 % |
| 200‑day moving average | $0.4805 |
Optimistic Price Analysis
Brief conclusion:
- The daily chart shows an oversold condition, increasing the likelihood of a short‑term bounce.
- The 4‑hour chart remains in a consolidation phase, with no clear trend reversal yet.
- If OP can recover to the $0.21‑$0.22 range, the medium‑term outlook is relatively stable; otherwise, downside pressure could push the price toward $0.18.
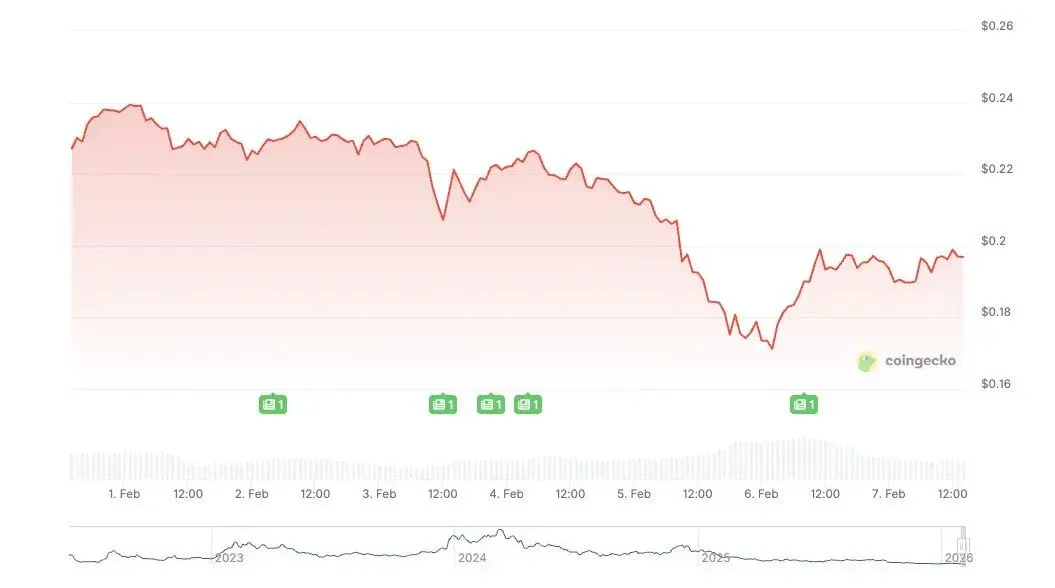
Optimistic Index – 1‑Day Price Chart
OP opened around $0.1974. As of 7 Feb, the trading price hovered near $0.1971, indicating that after a sharp sell‑off the market is still in a wait‑and‑see mode. Earlier, OP fell roughly 30 % from a late‑January peak of about $0.28. The current price sits below the daily Bollinger Band’s middle line (≈ $0.263), suggesting a down‑trend bias. If selling pressure intensifies, the lower band (≈ $0.174) could become the next resistance level.
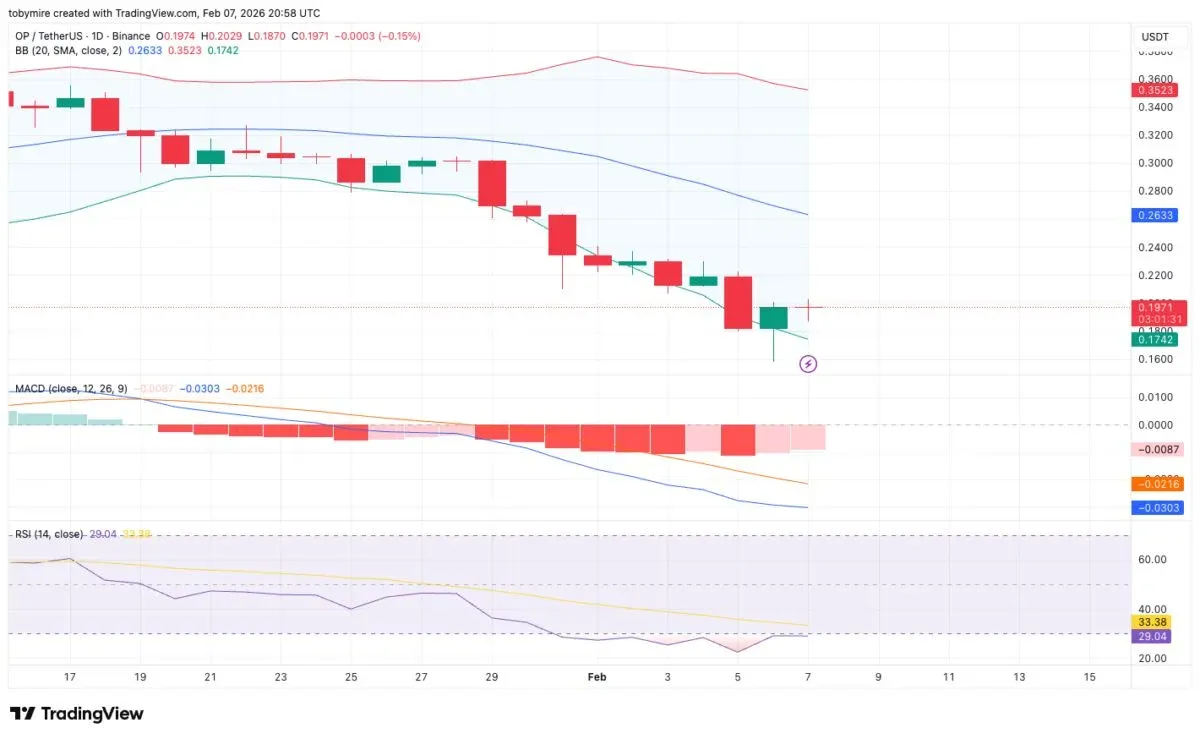
Daily OP/USDT price chart provided by TradingView
The MACD remains deep in negative territory, indicating weak momentum; however, the narrowing histogram suggests that downward thrust is losing steam. RSI hovers near 29, signalling severe oversold conditions—often a precursor to a brief rebound, but not necessarily a structural reversal.
Optimistic Sentiment – 4‑Hour Price Chart
On the 4‑hour timeframe, OP opened near $0.1969 and is currently trading around $0.1978. The token previously dipped to $0.16, then rallied roughly 20 % from that intraday low. Presently OP is forming a “crocodile” (range‑bound) pattern between $0.195‑$0.198, indicating consolidation rather than an expanding trend.
See also the 2025‑2031 NEM price forecast: *Is NEM a good investment?*
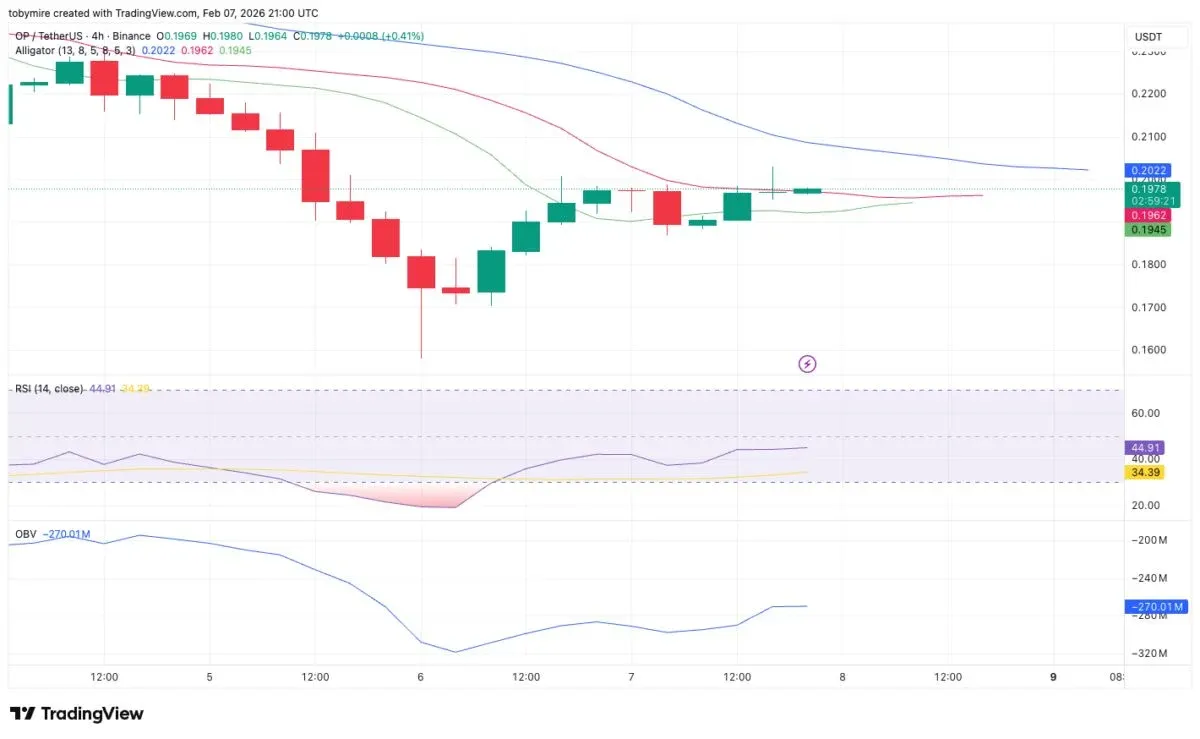
4‑hour OP/USDT price chart provided by TradingView
RSI has climbed back to roughly 40, indicating modest improvement in short‑term momentum; the On‑Balance Volume (OBV) indicator is also trending upward, hinting at early accumulation. Nevertheless, price still faces resistance near $0.202 within the crocodile pattern. If the token repeatedly stalls between $0.20‑$0.205, another decline toward $0.185 could follow.
Optimistic Technical Indicators: Levels & Actions
Simple Moving Averages (SMA)
| Period | Value | Action |
|--------|-------|--------|
| SMA 3 | $0.3186 | Sell |
| SMA 5 | $0.3096 | Sell |
| SMA 10 | $0.3156 | Sell |
| SMA 21 | $0.3195 | Sell |
| SMA 50 | $0.3059 | Sell |
| SMA 100 | $0.3505 | Sell |
| SMA 200 | $0.5141 | Sell |
Exponential Moving Averages (EMA)
| Period | Value | Action |
|--------|-------|--------|
| EMA 3 | $0.3229 | Sell |
| EMA 5 | $0.3199 | Sell |
| EMA 10 | $0.3099 | Sell |
| EMA 21 | $0.3008 | Buy |
| EMA 50 | $0.3214 | Sell |
| EMA 100 | $0.3925 | Sell |
| EMA 200 | $0.5338 | Sell |
What Can Optimism Bring?
OP is currently in a technical pause, with oversold conditions providing a floor for price stability. However, without a clear volume surge and a breakthrough of the upper resistance, the broader trend remains bearish.
Is Optimism a Good Crypto Investment?
If you are bullish on Ethereum scaling and the evolution of Layer‑2 solutions, OP may merit attention. As with all crypto assets, it carries risk; its value depends on market adoption and overall sector dynamics. Only allocate capital you can afford to lose.
Will the Market Recover?
Recovery is not impossible, but prevailing bearish sentiment could limit the magnitude of any short‑term bounce. As the market enters a consolidation phase, volatility may ease, and any price breakout will hinge on subsequent market dynamics.
Can OP Reach $50?
For OP to hit $50, an exceptionally favorable environment would be required—e.g., a massive surge in Ethereum usage, widespread deployment of Layer‑2 solutions, and a robust overall crypto market rally.
Can OP Reach $100?
Achieving $100 entails similarly dramatic growth and adoption, representing a highly challenging scenario.
Does Optimism Have a Strong Long‑Term Outlook?
From a technological roadmap and ecosystem development perspective, Optimism shows long‑term growth potential, and market interest remains generally positive.
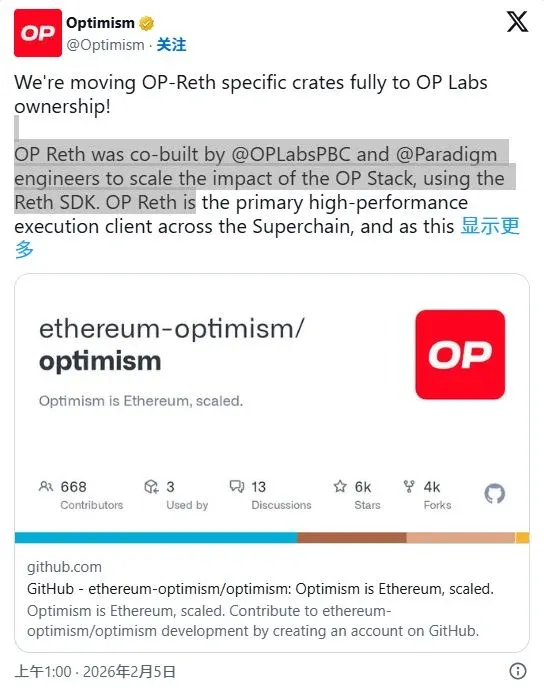
Recent Optimism News / Opinions
Optimistically, the OP‑Reth specific box will be fully transferred to OP Labs ownership!
February 2026 Optimistic Price Forecast
The forecast for February 2026 indicates a price range of:
- Low: $0.1503
- Mean: $0.2210
- High: $0.2892
Full‑Year 2026 Optimistic Forecast
The projected high for 2026 is about $0.76, the low around $0.25, and the average near $0.53.
| Year | Low | Average | High |
|------|-----|---------|------|
| 2026 | $0.25 | $0.53 | $1.01 |
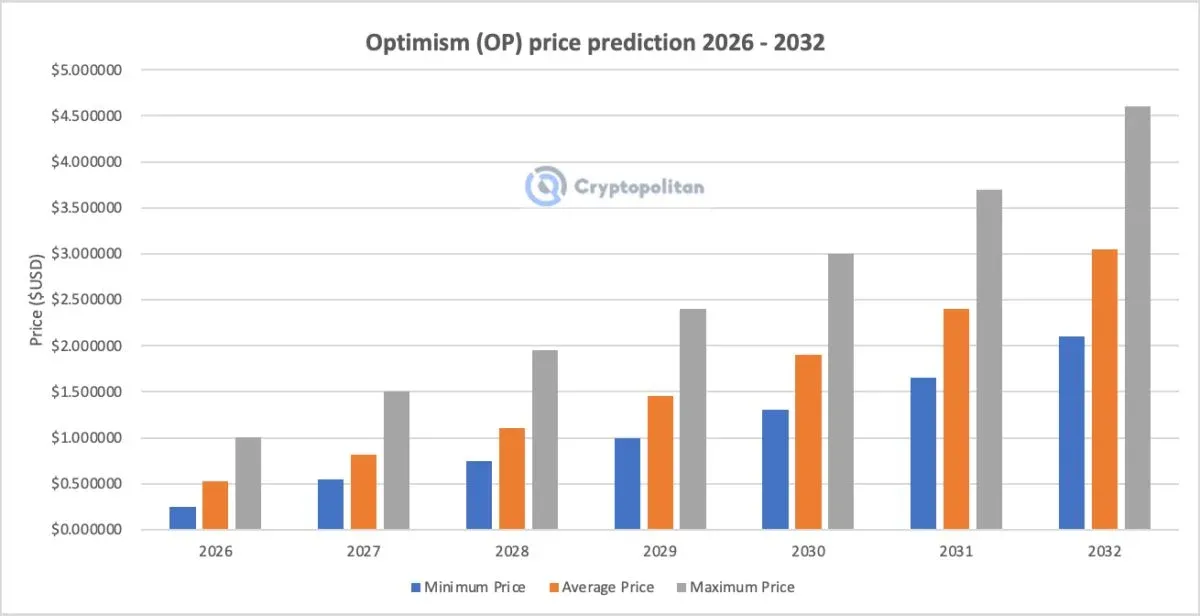
2027‑2032 Optimistic Forecast
| Year | Low | Average | High |
|------|-----|---------|------|
| 2027 | $0.55 | $0.82 | $1.50 |
| 2028 | $0.75 | $1.10 | $1.95 |
| 2029 | $1.00 | $1.45 | $2.40 |
| 2030 | $1.30 | $1.90 | $3.00 |
| 2031 | $1.65 | $2.40 | $3.70 |
| 2032 | $2.10 | $3.05 | $4.60 |
2027 Forecast
High $1.50, average $0.82, low $0.55.
2028 Forecast
Peak $1.95, average about $1.10, low $0.75.
2029 Forecast
Peak $2.40, average about $1.45, low $1.00.
2030 Forecast
Low $1.30, high $3.00, average $1.90.
2031 Forecast
High $3.70, low $1.65, average about $2.40.
2032 Forecast
Low around $2.10, high $4.60, average $3.05.
Optimistic Market Price Forecast: Analyst OP Predictions
| Analyst/Platform | 2026 | 2027 |
|------------------|------|------|
| CoinCodex | $0.8695 | $0.7073 |
| Digital Coin Price | $0.65 | $0.93 |
Cryptopolitan’s OP Price Forecast
Cryptopolitan adopts a cautious stance on Optimism’s overall outlook. Their highest 2026 estimate ranges between $1‑$2. Over the next few years, they anticipate a notable upside, projecting a rise from a low of $12.65 to a 2032 high of $17.98.
Optimistic Historical Price Sentiment
Coingecko’s historical sentiment summary:
- OP launched on 31 May at $4.57. Following the UST de‑peg and LUNA collapse, the token fell to $0.5434 in June and further to $0.4147 in mid‑July. A brief rebound in August pushed it above $1.90, but the October FTX fallout dragged it down to $0.70.
- In Q1 2023, during a bull market, OP surged past $3, then retraced 66 %, closing the quarter at $3.90.
- 2024 saw high volatility: a March peak of $4.85 (all‑time high), a mid‑April dip below $2.30, a short‑lived May rally above $2.90, July trading between $1.82‑$1.96, October sliding to $1.54‑$1.62, November briefly up to $2.60, and December ending in the $1.61‑$2.77 range.
- 2025: January peak $2.18, February trough $0.84, March high $0.9346, May $0.8523, June $0.7478, July $0.86.
- August traded between $0.6178‑$0.880, September average $0.74.
- November range $0.2888‑$0.4516, December $0.3117‑$0.3264.
- January 2026 range $0.2213‑$0.3731, February $0.1887‑$0.1997.
Frequently Asked Questions
What is Optimistic Summation?
Optimistic Summation works similarly to a zero‑knowledge roll‑up but assumes transactions are valid unless contradictory evidence appears. Computation is only performed when transaction integrity is challenged.
What is the purpose of Optimism?
Optimism is a fast, reliable, and scalable Layer‑2 blockchain built by Ethereum developers specifically for Ethereum users. Its architecture mirrors the EVM, allowing Ethereum applications to scale without unintended side effects and at significantly reduced cost.
How does Optimism function?
Optimism operates as a Layer‑2 chain on top of the Ethereum mainnet. Transactions are executed on Optimism, and the resulting data is later submitted to Ethereum for final settlement.
Is the Optimism EVM compatible?
Yes. Optimism is fully compatible with all Solidity contracts and Ethereum libraries, enabling development and deployment using the Ethereum Virtual Machine (EVM).
What is the price of OP in 2026?
At the time of writing, OP trades between $0.32‑$0.35.
What is the role of the Optimism token?
Optimism (OP) is the governance token of the Optimism Layer‑2 blockchain. Holders can vote on protocol upgrades and fund projects through Retroactive Public Goods Funding (RPGF). The total supply is 4.29 billion tokens, playing a crucial role within the Superchain ecosystem, collaborating with Base and Arbitrum, and backed by institutional investors such as a16z, Paradigm, and Coinbase.
💡 Register on Binance with referral code B2345 for the maximum trading fee discount. See Binance complete guide.


