
In the valuation framework of crypto assets, Fully Diluted Valuation (FDV) has become a key metric for assessing a project's potential scale. Compared with market capitalization derived solely from circulating supply, FDV imagines the highest possible market cap the project could reach if all tokens were unlocked and entered the market. Because the majority of tokens are locked at launch for the team, early investors, or ecosystem funds, there is often a substantial gap between the two figures. This gap is a critical factor that investors must monitor when planning long‑term positions.

In this article we systematically outline the concept and calculation method of Fully Diluted Valuation (FDV), dissect its fundamental differences from traditional market cap, and provide a practical framework to help investors conduct more precise value assessments during token unlock periods. To learn how to incorporate FDV into your investment decisions, keep reading.
What Is Fully Diluted Valuation (FDV)?
Fully Diluted Valuation refers to the total market value of a project under the assumption that every possible token has been issued and is circulating at the current trading price. In other words, FDV reflects the “maximum” valuation level the project could display if no tokens were locked or pending issuance.
By contrast, market capitalization only accounts for the number of tokens that are actually in circulation today. The difference between the two metrics stems primarily from token lock‑up schedules and distribution progress. This distinction is especially important in crypto because large token pools are often released gradually over several years, creating a potential supply expansion.
Basic Method for Calculating FDV
The FDV formula is straightforward:
FDV = Current Token Price × Maximum Supply
Market cap, on the other hand, is based on circulating supply:
Market Cap = Current Token Price × Circulating Supply
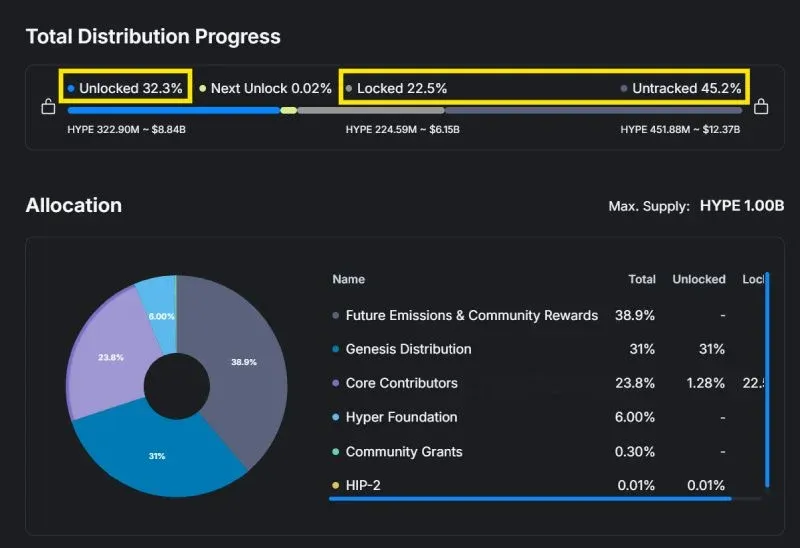
Illustrative Example: As of January 28 2026, Hyperliquid (ticker HYPE) traded at $27.25 USD, and its maximum supply is 1 billion tokens. Its FDV is therefore:
FDV = 27.25 × 1,000,000,000 = $2.725 billion USD**
At the same point in time, HYPE’s circulating supply was about 238,385,315 tokens, giving a market cap of roughly $6.49 billion USD. The large disparity signals that most tokens are still off‑exchange, and future unlocks could exert dilution and sell‑pressure that merit close observation.
The Significance of FDV for Different Types of Investors
Retail (Individual) Investors
For everyday participants in the secondary market, market cap offers a snapshot of a project's current size, while FDV helps them anticipate the potential value held by all token categories—team, funds, early backers—once every token is released. By pairing FDV with the token‑economics model, retail investors can estimate:
- The highest possible valuation of tokens owned by the team and investors;
- The multiple of returns those holders could realize once their allocations begin to unlock;
- The price impact that subsequent supply increases might generate.
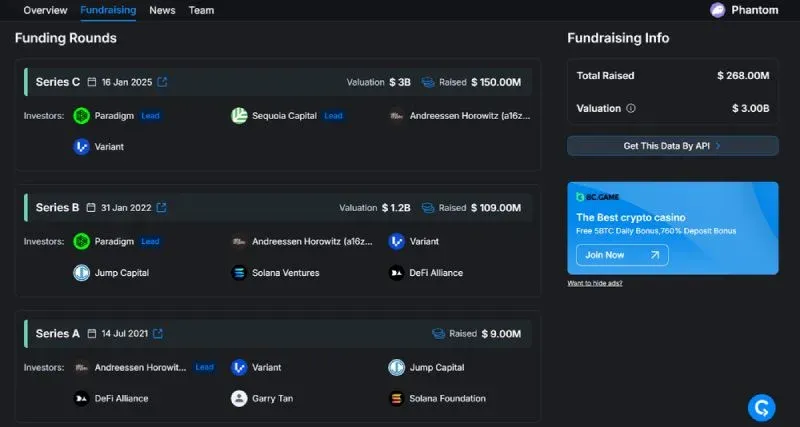
Example: The Phantom project reported the following FDVs across its financing rounds:
- Series A (July 2021): several hundred million USD (exact figure not disclosed);
- Series B (January 2022): $1.2 billion USD;
- Series C (January 2025): $3.0 billion USD.
If the project ultimately lists at an approximate $3.0 billion USD valuation, the theoretical returns for each round would be roughly:
- Series A: 10‑15×;
- Series B: about 2.5×;
- Series C: close to 1× (break‑even).
These returns are not realized instantly; they materialize gradually as tokens unlock and market prices fluctuate.
Venture Capital (VC) Firms
For institutional investors, FDV serves more as a reference benchmark rather than the sole determinant of actual returns. Realized performance depends on the token’s unlock cadence and the timing of sales. Consider the following illustration:
Assume a VC backs a project with an FDV of $400 million USD. Tokens are scheduled to unlock at 10 % per month over ten months. If the fund sells the corresponding tranche each month at the indicated FDV price:
- Month 1: sell 10 % at an FDV of $1 billion USD;
- Month 2: sell 10 % at an FDV of $2 billion USD;
- Month 3: market correction, sell 10 % at an FDV of $200 million USD;
- …
- Month 10: sell the final 10 % at the original $400 million USD FDV.
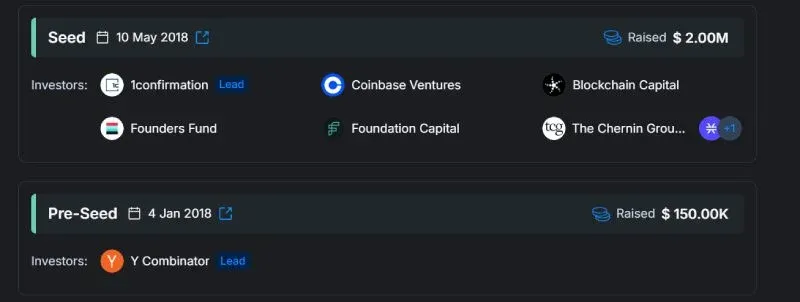
This scenario shows that overall profit is the cumulative result of all individual sale transactions, not simply the highest or lowest FDV figure. Moreover, price volatility during the unlock period, project milestones, and reputational risk all influence the final outcome. Early investors in OpenSea entered the seed round in 2018 but, as of 2026, the token generation event (TGE) has not yet occurred, leaving capital locked for an extended period and illustrating how equity‑grant timelines can constrain VC liquidity.
Interpreting the FDV‑to‑Market‑Cap Ratio
The FDV/Market‑Cap ratio measures the proportion between a project's maximum potential valuation and its current market cap, providing an immediate sense of how much of the total supply is already circulating versus how much remains dilutable.
- High Ratio: Indicates that a large share of tokens is still locked; future supply expansions could exert considerable downward pressure on price.
- Ratio Near 1: Suggests most tokens are already in circulation, implying lower dilution risk and a more stable supply structure.
Consequently, many investors use this ratio as a quick screening tool:
- Low Ratio → Dilution risk is modest, potentially suitable for medium‑ to long‑term holding.
- High Ratio → Caution is warranted due to possible supply shocks when tokens unlock.
Does a High FDV Automatically Signal a Negative Outlook?
FDV alone does not constitute a judgment of a project's quality. The crucial question is whether the valuation aligns with the project's genuine capacity to create value.
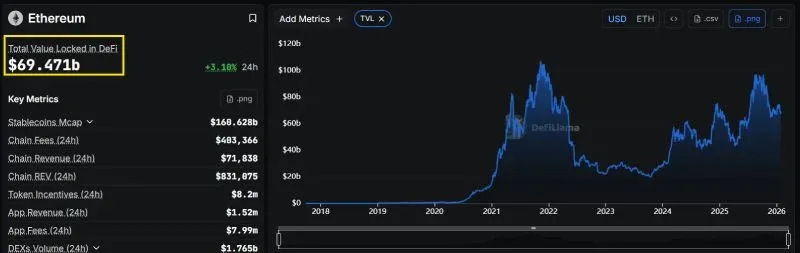
- Infrastructure or Base‑Layer Protocols: Take Ethereum as an example; its FDV of roughly $350 billion USD reflects its central role in smart contracts, DeFi, real‑world assets (RWA), and other ecosystem components. The market’s premium expectations for long‑term growth are, to a degree, justified.
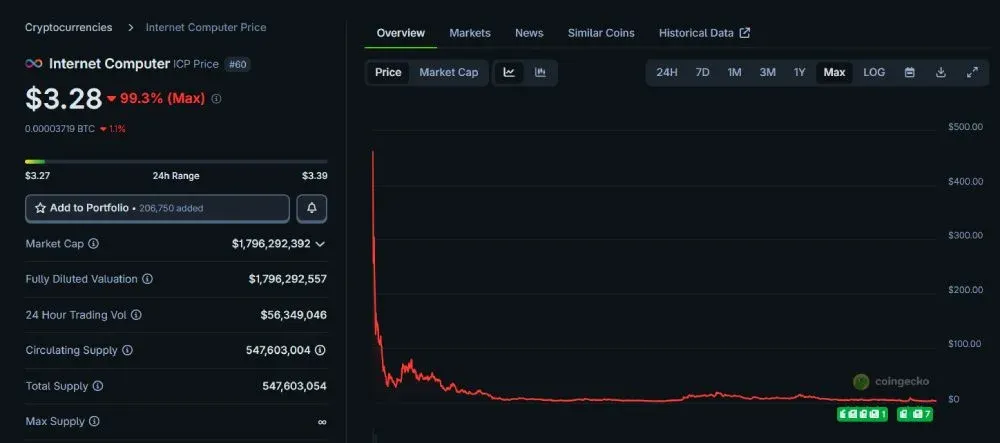
- Early‑Stage New Projects: When a nascent protocol launches with a multi‑hundred‑billion‑USD FDV, it often indicates an overheated valuation. The Internet Computer (ICP) debuted in 2021 with an FDV close to $400 billion USD, only to see its price tumble more than 99 % later, leaving an FDV of about $18 billion USD—a stark illustration of the gap between hype‑driven valuations and actual adoption.
Thus, a high FDV is not inherently negative, but for projects that have yet to prove their value‑creation mechanisms, investors should scrutinize dilution risk and realistic upside potential.
Common Misconceptions and Correct Understanding
- FDV Equals a “Guaranteed Target”
FDV is merely a hypothetical market cap based on the current price. In reality, price rarely remains static as supply expands, and it certainly does not automatically climb to the level implied by FDV.
- Ignoring the Unlock Schedule
Two projects with identical FDVs can have vastly different risk profiles if one unlocks all tokens within six months while the other spreads releases over seven years. The speed of token release is a vital dimension of risk assessment.
- Looking at FDV in Isolation from Tokenomics
FDV only becomes a meaningful reference after examining token allocation, lock‑up plans, and ownership structures. Relying on FDV alone often leads to misjudgments.
Frequently Asked Questions
What exactly does FDV represent in crypto valuation?
- FDV denotes the total market value the project would have if every possible token were issued and circulating at the current trading price.
Why should long‑term investors pay attention to FDV?
- FDV reveals the potential scale of future dilution, helping assess how an expanding supply might affect price over the long run.
How does FDV influence token price trajectories?
- A higher FDV typically caps long‑term upside and raises the risk of sell‑pressure once tokens unlock.
Do projects with the same FDV carry identical risk?
- Not necessarily. Differences in unlock schedules, distribution ratios, and holder composition can lead to markedly different risk levels.
Does a low FDV guarantee high returns?
- A low FDV merely indicates comparatively modest valuation risk; the project's technology, market fit, and execution remain decisive factors for any return.
*Note: Crypto gains may be taxable in your jurisdiction. Consult a tax professional for guidance on reporting and compliance.*
Conclusion
Fully Diluted Valuation offers investors a lens through which to evaluate potential dilution risk and the behavior of large‑holder groups. When combined with tokenomics, unlock timelines, and supply structure, FDV can help determine whether a project is truly undervalued or simply appears “cheap” on the surface, and it can foreshadow possible future sell‑offs. Properly understanding and applying FDV aids in avoiding valuation traps and crafting a more robust investment strategy.
This article ends here. To explore more about FDV, you can search for Bitaigen’s previous articles or continue browsing the related links below. We appreciate your continued interest and support for Bitaigen!
💡 Register on Binance with referral code B2345 for the maximum trading fee discount. See Binance complete guide.


