
 Bitaigen Research
Bitcoin met resistance around $107,000, with short‑term support zones clustered around $104,000, $100,000 and $95,000.
In this article we dissect Bitcoin’s recent resistance pressure, combine technical gaps with price structure, and systematically assess the short‑term support ranges that could emerge. By cross‑referencing charts with viewpoints from multiple institutions, readers can spot potential turning‑point signals and make more prudent decisions.
Key Takeaways
- Bitcoin failed to break above $107,000, a level that traders widely regard as a critical resistance.
- The market still retains the possibility of slipping back below $100,000.
- Analysts argue that bullish participants would need an exceptionally strong rally to once again approach the all‑time highs.
CME Gap Triggers Price Reversal
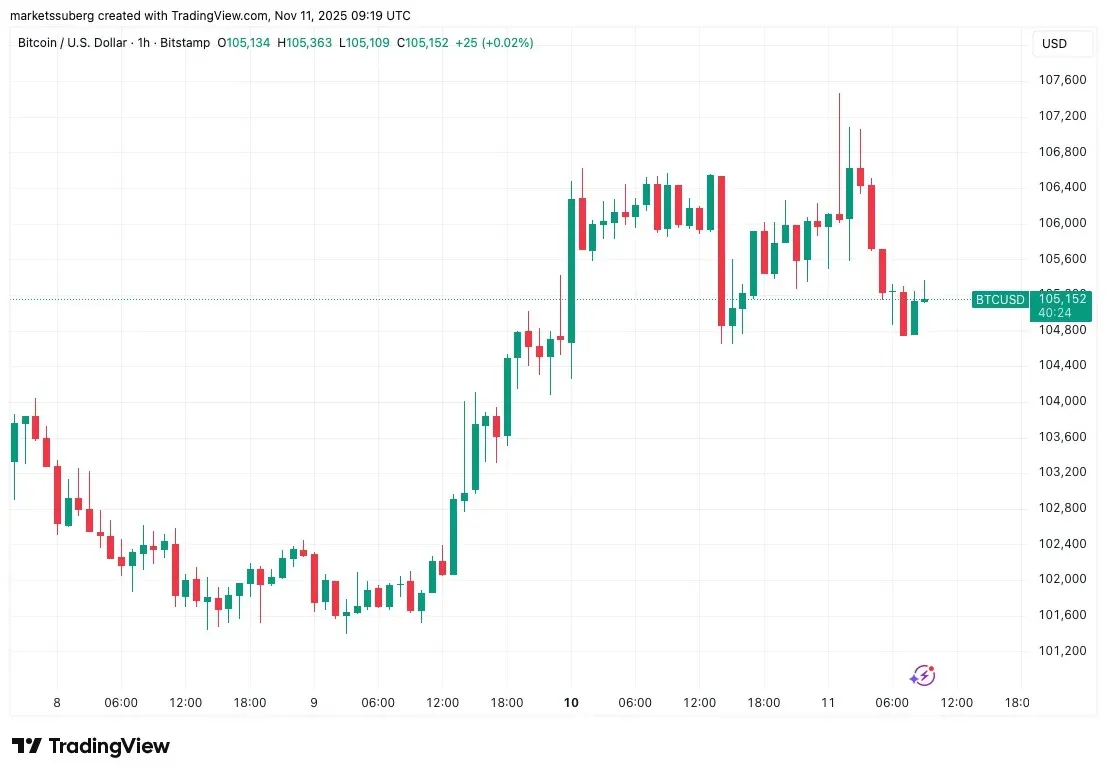
Data from Cointelegraph Markets Pro and TradingView show that BTC/USD could not reclaim the key support level overnight.
- After hitting a fresh high of $107,465 in November, Bitcoin/USD could not hold that level, and the hourly chart began to exhibit a double‑top formation risk.
- “$BTC is being rejected at the $107,000‑$108,000 resistance zone,” crypto investor‑entrepreneur Ted Pillows wrote on X.
CME Gap and Lower‑Side Support
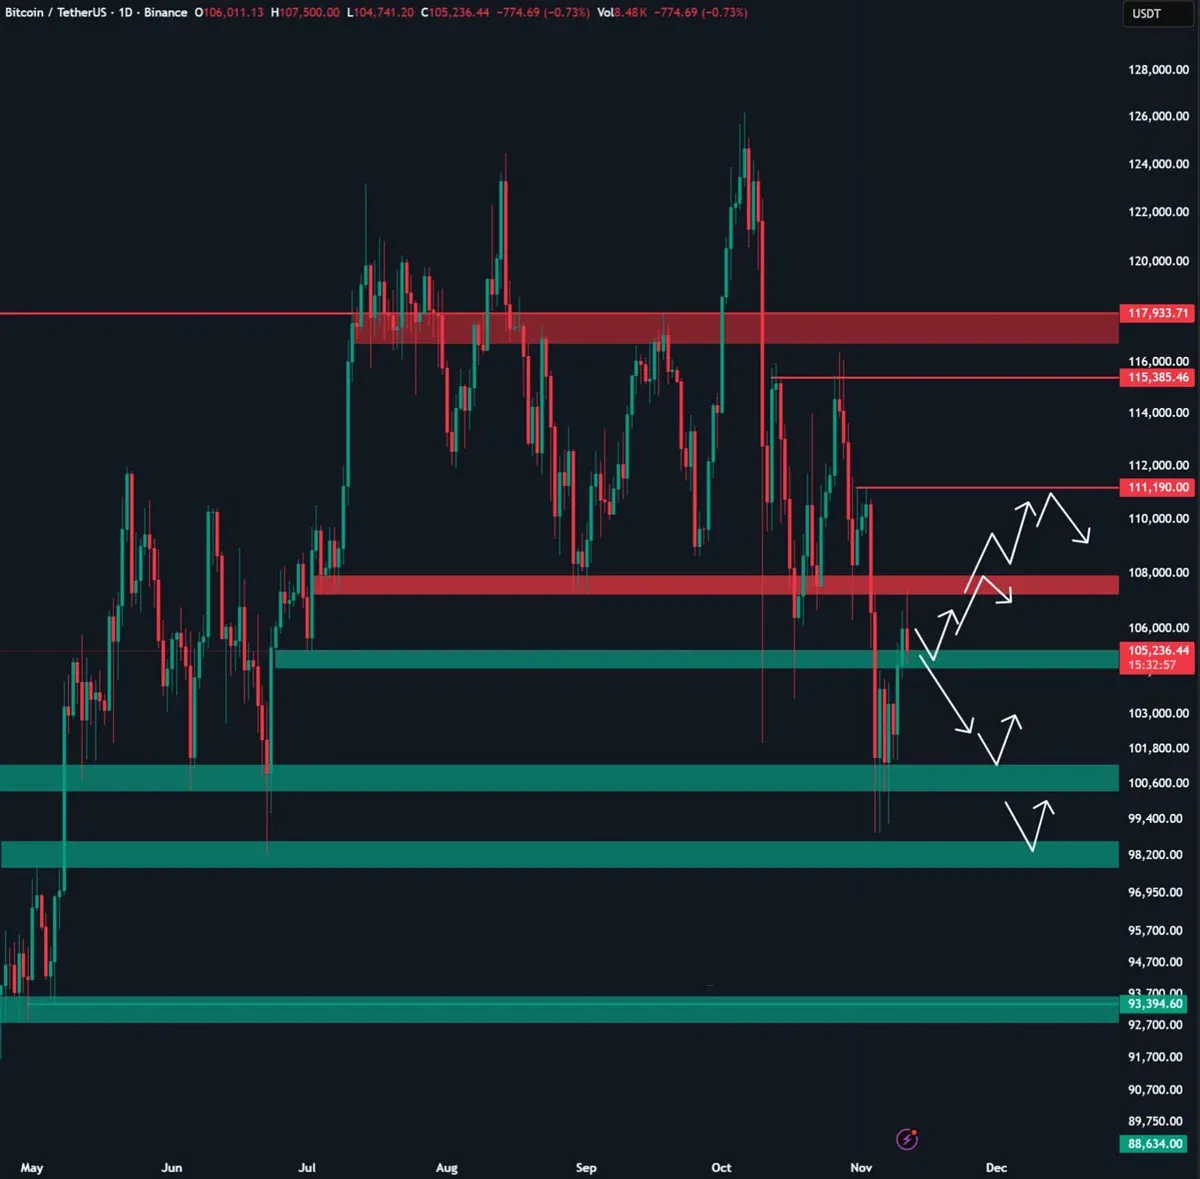
- Pillows points out that the latest gap on the CME futures market still sits below the spot price.
- He believes the next pivotal support lies near $104,000, accompanied by another CME gap. Historically, Bitcoin often finds a bottom on Tuesdays; if that pattern repeats, the gap could be filled and a rebound may follow.
Trader Perspective
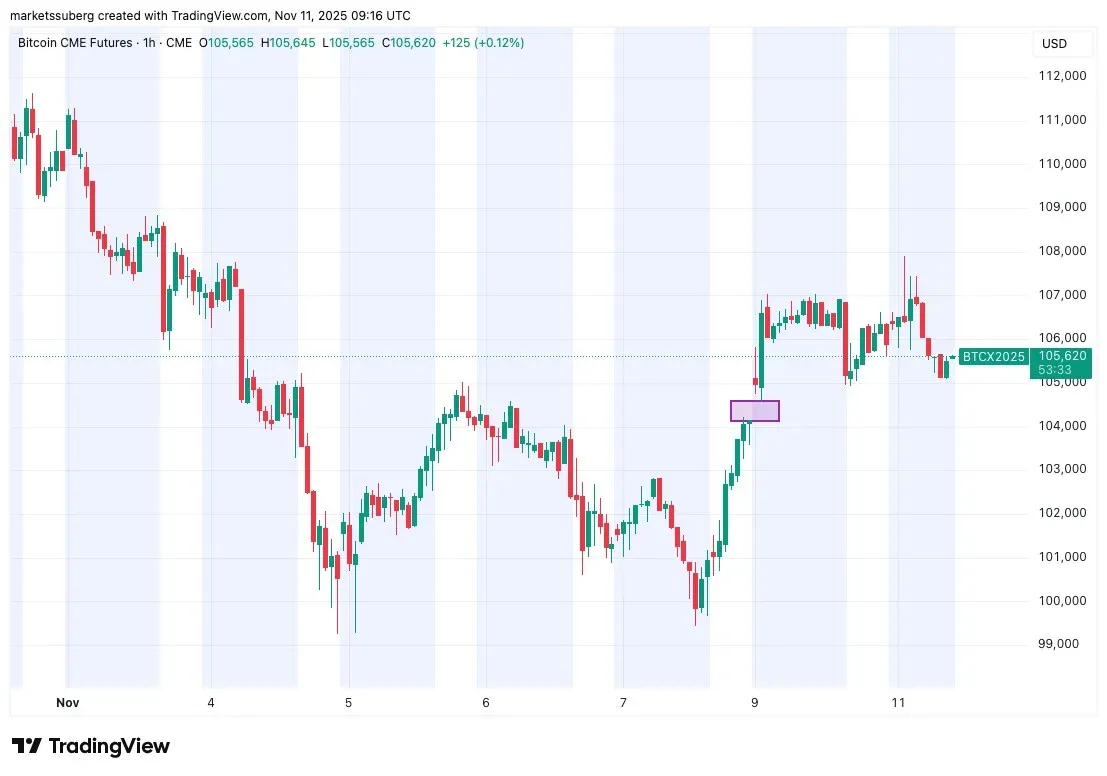
Trader Daan Crypto Trades argues that Bitcoin has not turned the resistance into support and remains under bearish control, with similar pullbacks evident in ETH and the overall crypto market cap.
“$BTC Rejecting from the key $107K area so far. Similar to $ETH & The Total Crypto Market Cap rejecting from similar zones. Bears are still in control until this level is flipped.”
Further Support Assessment
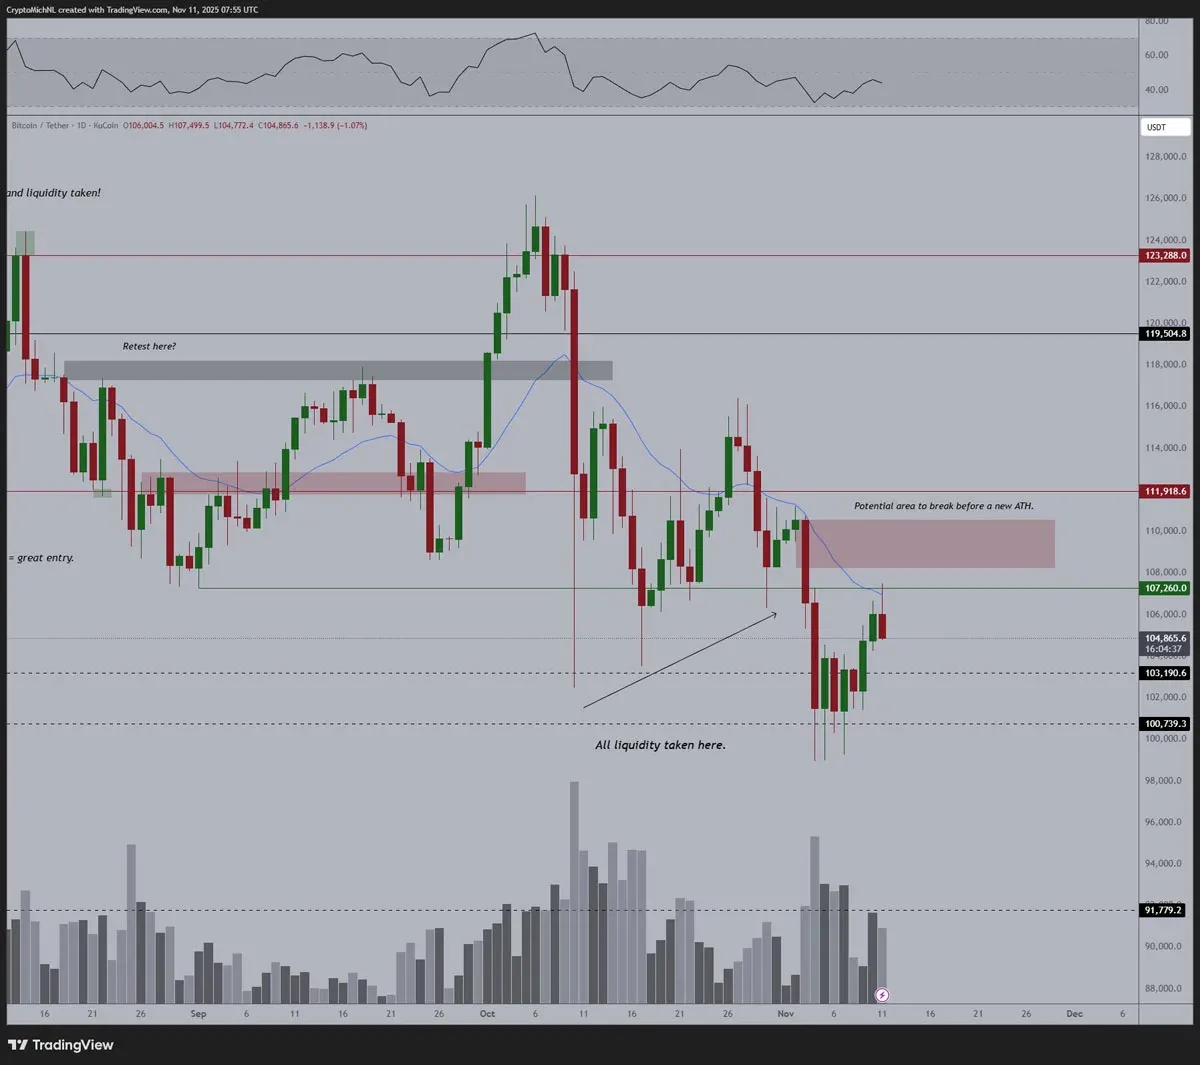
Crypto analyst Michaël van de Poppe posted on X: “Can Bitcoin hold $103,000? Will a double bottom form around $100,000?”
- If neither scenario materialises, the price could test the $90,000‑$93,000 band.
“OG Sell‑Pressure” Warning
Trading firm QCP Capital highlighted in its latest “Asia‑Color” report that for Bitcoin to sustain an upward trajectory, it will need supportive macroeconomic conditions and steady inflows from ETFs.
- A rebound in spot demand, favorable macro trends, and ETF capital could reignite buying pressure.
- However, if the price breaches $118,000, long‑term holders might unleash an “OG sell‑pressure” wave, leading to mid‑term range volatility.
“Long‑term holders tend to take profits above $100,000; in the short term the most likely scenario remains range‑bound oscillation.”
The above constitutes a support‑level analysis for Bitcoin after encountering the critical $107,000 resistance. For more details, follow additional articles on Bitaigen (比特根).
*Note for global users:* Fiat transactions are typically processed via USD, SEPA, or SWIFT channels depending on the region. U.S. residents should use Binance.US rather than the global Binance platform. Cryptocurrency gains may be subject to taxation in your local jurisdiction; please consult a tax professional for guidance.
[[IMGMARK_5]]
Related Reading
- Bitcoin Post‑Halving: Is the 4‑Year Cycle Over?
- Bitcoin tests key support, repositioning targets $101.5K
- Bitcoin Breaks $84,000 Support: Can BTC Drop to $50,000?
💡 Register on Binance with referral code B2345 for the maximum trading fee discount. See Binance complete guide.



