 Bitaigen Research
 This article examines Bitcoin's recent key support level and the drivers behind bullish repositioning from the perspective of liquidation heatmaps and moving‑average crossovers. We focus on interpreting the futures market's leading signal and discuss the possible price‑action logic if the trend continues, helping readers identify potential opportunities in the upcoming market.

Hyblock’s 7‑day liquidation heatmap shows that forced liquidations of long positions are concentrated between $89,000 and $87,000, while short positions are clustered near the weekly‑high region around $95,000.
From a technical standpoint, the upward move earlier this year lifted Bitcoin above its 20‑day moving average, which is now gradually converging with the 50‑day moving average. Should Bitcoin fail to hold the critical $95,000 level, short positions would be forced to liquidate, prompting some traders to take profit and setting the stage for a subsequent test of the 20‑day moving‑average support near $89,400.
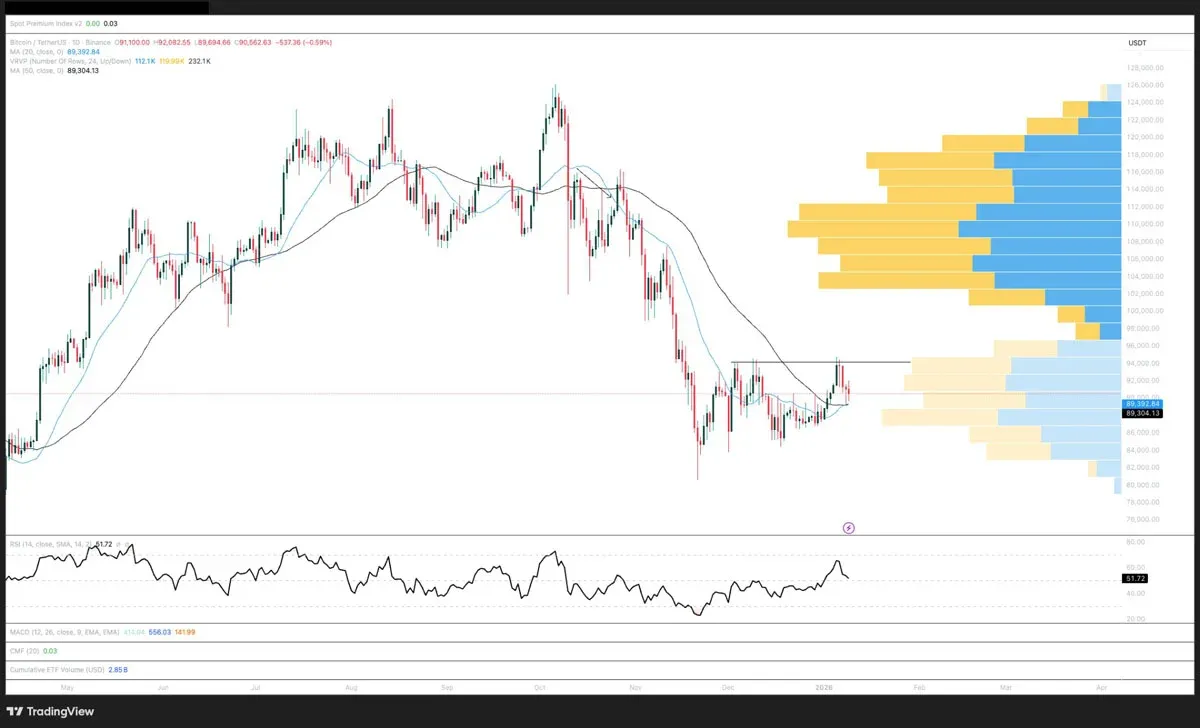
On the BTC/USDT daily chart on the Binance platform (U.S. users should refer to Binance.US), if the current uptrend persists and volume continues to support it, Bitcoin could retest the $95,000 threshold within the next few days. Should that scenario materialise, the combined effect of short covering and forced liquidations would create an opening for long positions, allowing the price to move toward $101,500 (approximately a 13 % gain) by exploiting gaps in the volume distribution.
Chart data indicates that most of Bitcoin’s intraday volatility this week stemmed from forced liquidations triggered in perpetual contracts. Specifically, when Bitcoin reached $94,800 on January 5, futures buying volume surged to roughly $1.1 billion; during the same interval, about $100 million of short positions on Binance’s BTC/USDT contract were liquidated, amplifying the upward price momentum (source: TRDR.io).
Bitcoin traders’ sentiment has shifted from cautious to bullish, with the futures market playing a particularly pronounced role. As price finds support near $95,000, longs are re‑positioning in anticipation of capturing further upside in subsequent moves.
Since the start of 2026, Bitcoin and several major altcoins have climbed back to the upper part of their weekly ranges. The broader market atmosphere is characterised by renewed investor confidence and a simultaneous rise in trading volume. From January 1 onward, Bitcoin’s daily chart has shown a narrowing range, with both highs and lows trending upward, culminating in a weekly high of $94,800 this week.
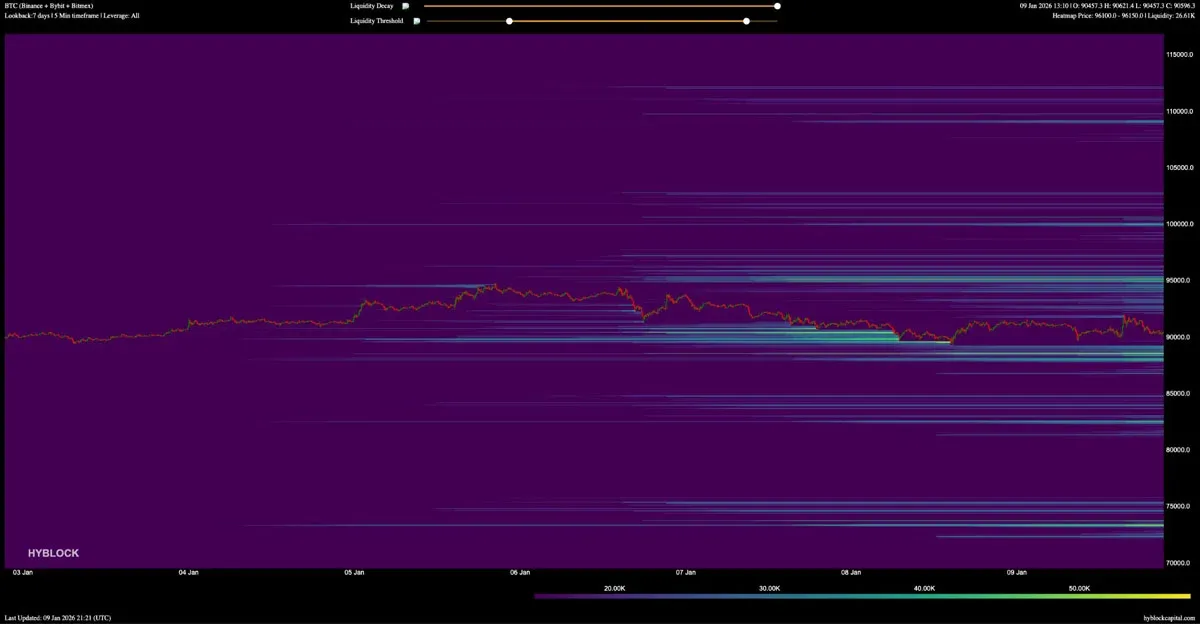
Trader activity is also driving the price. The current liquidation heatmap and order‑book structure suggest that if Bitcoin approaches $94,000, a similar wave of forced liquidations and short covering could recur.
The above outlines Bitcoin’s (BTC) testing of a key support level, the re‑positioning of longs, and the futures‑driven rally that lay the groundwork for a potential push toward $101,500. For further in‑depth analysis of Bitcoin’s support‑level dynamics and bullish futures targets, please follow additional articles from Bitaigen.
Related Reading
- Bitcoin Breaks $84,000 Support: Can BTC Drop to $50,000?
- Bitcoin Analysis: Trump Media's $2B BTC Purchase Shows Loss
- Bitcoin 2026 Forecast: $64K‑$65K Support & Market Sentiment
💡 Register on Binance with referral code B2345 for the maximum trading fee discount. See Binance complete guide.



