
 Bitaigen Research
 Bitcoin (BTC) Price Halved: $2.3 Billion Crash Marks Largest Drop Since 2021—Where is the Market Heading Next?

Bitcoin recently recorded a realized loss of $2.3 billion, marking the most significant capitulation event since 2021. The key to the future price trend lies in the realized price support level of $55,000. While such extreme sell-offs are often followed by short-term technical rebounds, analysts expect the market will still need to bottom out through a period of sideways consolidation, with a potential support zone located between $40,000 and $60,000.
The cryptocurrency market has recently encountered severe volatility, with Bitcoin experiencing extreme selling pressure in a short period. By conducting an in-depth analysis of on-chain data, the Bitaigen editorial team has found that the current market has entered a historic "capitulation phase." This article will review the underlying logic behind this major crash and, by comparing it with historical cycles, explore the key support levels during the market's bottoming-out process. In the face of extreme negative sentiment, how will future trends evolve? We recommend a thorough reading to gain more rational market insights.
A Historic "Capitulation Event": $2.3 Billion in Realized Losses
Bitcoin is currently undergoing one of the largest sell-offs in the history of cryptocurrency, as short-term holders have chosen to exit their positions at a significant loss during the price decline. According to the latest data, Bitcoin's seven-day average net realized loss has reached a staggering $2.3 billion.
In a report released on Thursday, CryptoQuant analyst IT Tech pointed out that the scale of this loss qualifies as "one of the most severe capitulation events in Bitcoin's history." The intensity of this sell-off can be compared to several key historical milestones:
- The 2021 Great Crash: A period of extreme panic in market sentiment;
- The 2022 Collapse: The chain reaction triggered by the Luna collapse and the FTX bankruptcy;
- The Mid-2024 Correction: A phase of cyclical market flushing.
IT Tech added: "The current level of loss places us among the top three to five most severe loss events Bitcoin has ever seen. Historically, there have only been a handful of moments where this level of capitulation has occurred."
Currently, Bitcoin has fallen nearly 50% from its historical high of over $126,000 in October, with the trading price hovering around $66,600. Previously, the asset had begun a volatile climb from a low of $60,000 on February 6. For global investors looking to re-enter the market, it is important to note that US-based users must utilize Binance.US, as the global Binance platform is restricted in that jurisdiction. Furthermore, when moving fiat currency via SEPA or SWIFT for large-scale acquisitions, investors should remain mindful that cryptocurrency gains may be taxable depending on local regulations.
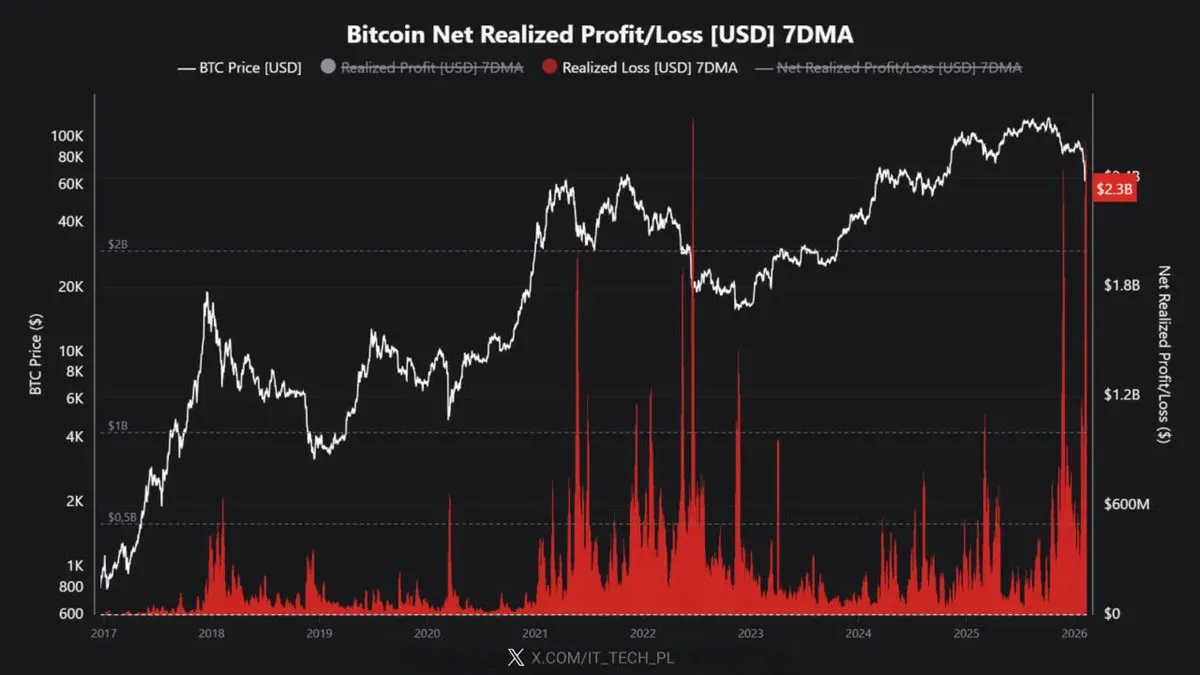
*Bitcoin experiences a historic realized loss. Source: CryptoQuant*
Market Outlook: A Deep and Slow Bottoming Process
Regarding future price movements, market analysis presents polarized views. IT Tech noted that while "extreme loss peaks often trigger retaliatory rebounds" (as seen when Bitcoin briefly returned above $70,000 on Tuesday), this does not necessarily mean the correction period has ended.
Core Observation Indicators:
- Realized Price: CryptoQuant posted on the X platform that $55,000 is currently the key realized price for Bitcoin. Historically, this level has been closely associated with bear market bottoms.
- Deviation Rate: In past cycles, the Bitcoin price has typically continued to drop between 24% and 30% below this level before achieving true stabilization.
- Consolidation Demand: When the price touches this core area, the market usually undergoes a period of horizontal consolidation rather than an immediate recovery.
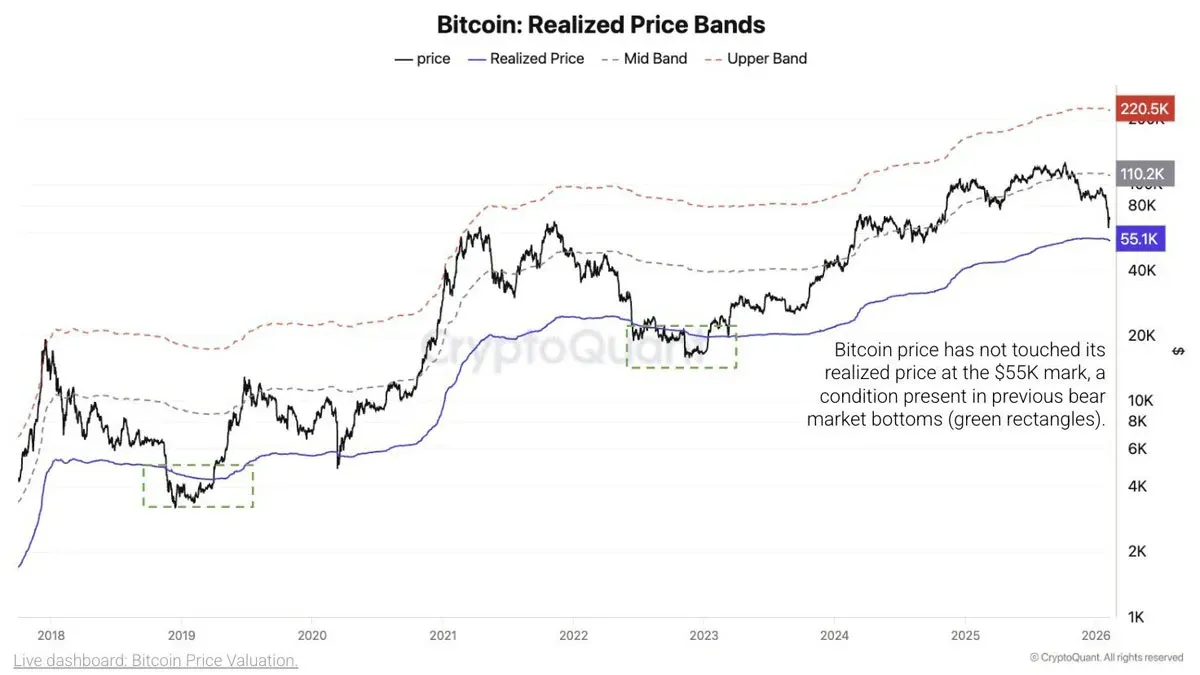
*Bear market bottoms are typically lower than Bitcoin's realized price (blue line). Source: CryptoQuant*
Finding the Bottom Will Still Take Time
Nick Luck, Research Director at LVRG, stated that the recent capitulation behavior reflects panic selling by short-term holders amidst macroeconomic pressures and the market's transition into a bearish zone.
He believes that while current oversold levels suggest a recovery phase is approaching, the confirmation of a true bottom still requires more signals:
- Institutional Fund Flows: Evidence of sustained buying by institutional investors, often visible through increased SWIFT-based transfers into major custodial accounts.
- Miner Activity: A reduction in selling pressure from miners and a stabilization of the network's hash rate.
Luck set the potential strong support range between $40,000 and $60,000. He emphasized that the specific location of the bottom will depend on the further evolution of market dynamics.
This concludes our in-depth analysis of the Bitcoin (BTC) price halving and the $2.3 billion crash. For more detailed information on Bitcoin market volatility and sell-off data, please continue to follow the reports from Bitaigen. Investors are reminded that all crypto-related activities involve risk, and capital gains may be subject to taxation per local jurisdiction requirements.
Related Reading
- UBS bearish on US stocks, Bitcoin slides under $65,500
- Gold & Silver Reach All‑Time Highs; Bitcoin Near $90K
- Bitcoin Decline Explained: Macro, Policy & On‑Chain Factors
💡 Register on Binance with referral code B2345 for the maximum trading fee discount. See Binance complete guide.



