
 Bitaigen Research
 In this article we uncover the hidden factors behind the latest sharp decline in Bitcoin, focusing on the deleveraging and short‑Gamma effects triggered by multi‑strategy hedge funds in the options market, and exploring the potential links with exchange‑traded funds (ETFs) and cross‑border trading. By dissecting data and offering expert perspectives, we help readers untangle the structural risks behind the surface‑level volatility and gain a deeper understanding of the true drivers of market swings.
The black‑swan event that caused the recent Bitcoin plunge was not merely market sentiment; it stemmed from multi‑strategy hedge funds activating deleveraging and a short‑Gamma effect in the options market, forcing a massive amount of paper‑money positions to be liquidated.
On February 5, the crypto market suffered another severe drop, with a 24‑hour liquidation volume exceeding $2.6 billion, and Bitcoin briefly fell below $60,000. The market lacked a unified explanation for the decline. Jeff Park, Chief Information Officer at Bitwise, offered a fresh analytical framework from the perspective of options and hedging mechanisms.

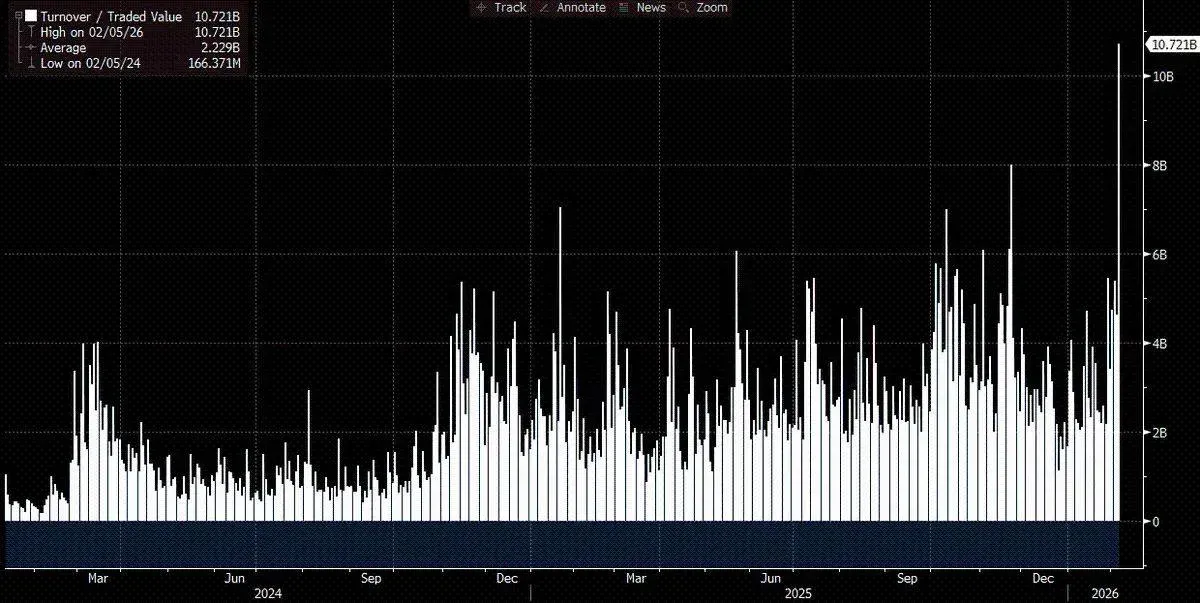
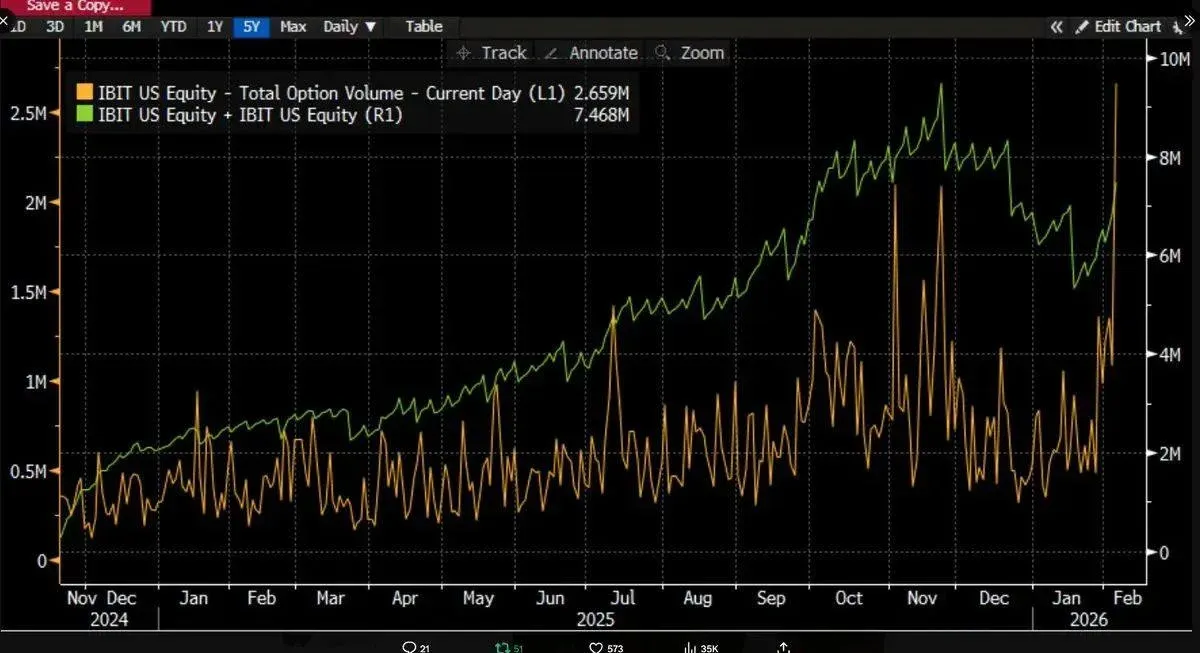
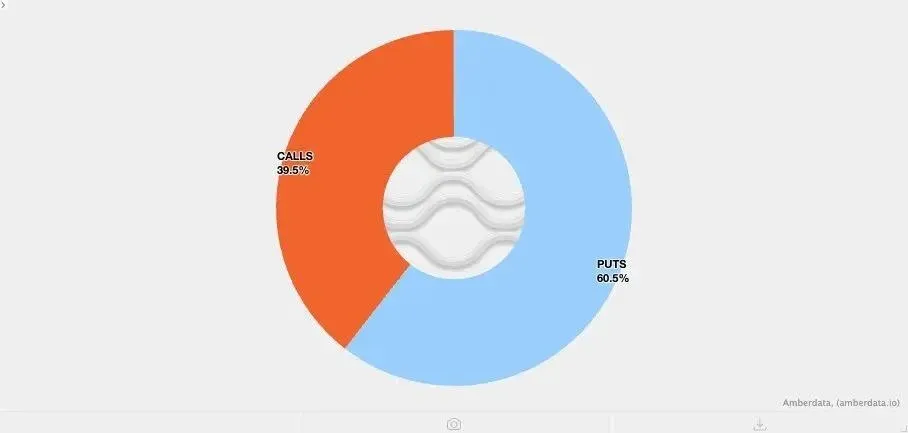
As more data emerged, the picture became clearer: the sell‑off was highly likely linked to Bitcoin ETFs, and abnormal trading was also observed in the Japanese market. The key piece of evidence is that IBIT (the ProShares Bitcoin Strategy ETF) recorded a daily turnover of over $10 billion, double its all‑time high, while options volume for the same day also hit a fresh peak (see chart below). Moreover, the proportion of put options surged markedly, indicating heightened concern over downside risk.
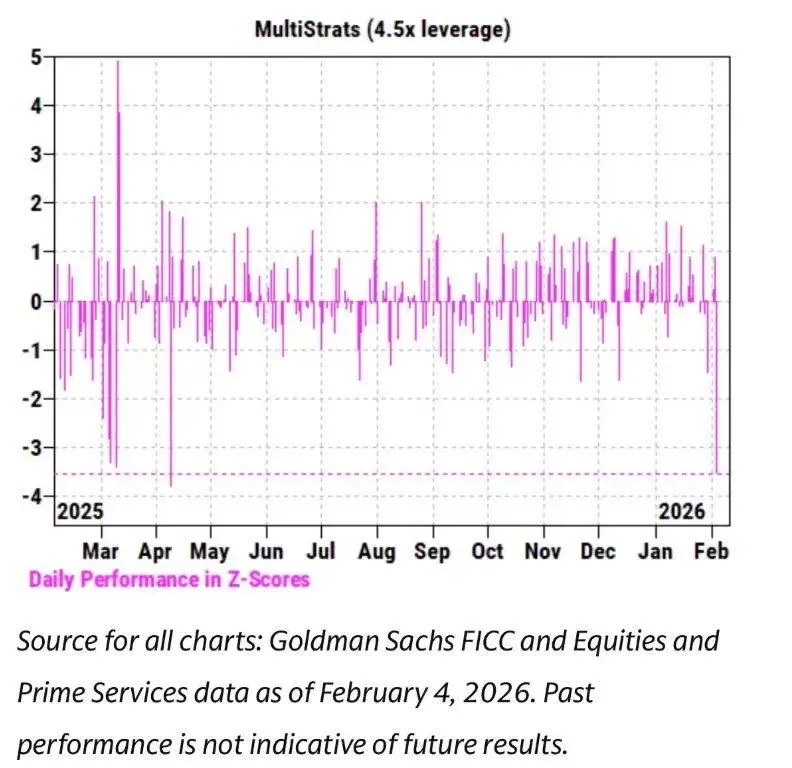
At the same time, IBIT’s price movement showed a strong correlation with software‑sector stocks and other high‑risk assets. Goldman Sachs’ Prime Brokerage (PB) team noted that February 4 was one of the worst single‑day performances in the history of multi‑strategy funds, with a Z‑score of 3.5, corresponding to a probability of only 0.05 %. Such extreme outliers usually trigger the risk‑management units of multi‑strategy “pod‑shop” funds to intervene, demanding an immediate, system‑wide deleveraging that directly caused the blood‑bath on February 5.
Given the slew of record‑breaking metrics and a single‑day price drop of 13.2 %, theory would predict net redemptions from ETFs. Historical patterns support this view: for example, after a 5.8 % decline on January 30, IBIT saw a record $530 million redemption the following trading day; similarly, during the consecutive falls on February 4, about $370 million was withdrawn. Consequently, an outflow ranging from $500 million to $1 billion seemed plausible at the time.
However, reality ran the opposite direction—IBIT recorded a net subscription of roughly 6 million shares on that day, adding over $230 million to its assets under management. Other Bitcoin ETFs also posted net inflows, bringing the entire ETF ecosystem to an aggregate $300 million+ of fresh capital.
This indicates that a simple price rebound cannot explain the shift from “potential outflows” to “net inflows”; multiple forces must have acted in concert. Based on the information currently available, the following reasonable hypotheses can be proposed:
- Trigger: The Bitcoin sell‑off spilled over into non‑pure‑crypto multi‑asset portfolios or strategies—such as multi‑strategy hedge funds or BlackRock‑style model portfolios—that allocate between IBIT and software‑sector ETFs (e.g., IGV) and were forced to rebalance.
- Options structure: Down‑side options, especially puts, dominated the current sell‑off, amplifying the deleveraging shock.
- Paper‑money dominance: The primary driver of the move came from dealers and market makers adjusting their hedge positions, rather than a physical outflow of Bitcoin assets.
Core Hypothesis Chain
- Immediate catalyst: Multi‑asset funds initiated broad deleveraging after risk‑asset correlations spiked unusually.
- Deleveraging process: It involved a large volume of delta‑neutral hedge positions (basis trades, relative‑value trades, etc.). When forced to unwind, these positions generated a short‑Gamma effect that pushed prices lower.
- Market‑maker behavior: During the violent sell‑off, market makers had to net‑short Bitcoin to preserve liquidity, inadvertently increasing ETF inventories and cushioning the expected massive capital outflow.
On February 6, IBIT saw another net subscription, as some buyers positioned themselves on the dip, offsetting the potential outflow.
Link Between Software‑Sector Stocks and Bitcoin
I am inclined to view the initial catalyst of this episode as the sell‑off in software‑sector equities, because Bitcoin’s correlation with software stocks is even higher than its correlation with gold (see chart below). Gold typically does not sit in the core holdings of multi‑strategy funds, whereas the volatility of software equities more readily triggers those funds’ deleveraging mechanisms, which then spill over into Bitcoin ETFs.
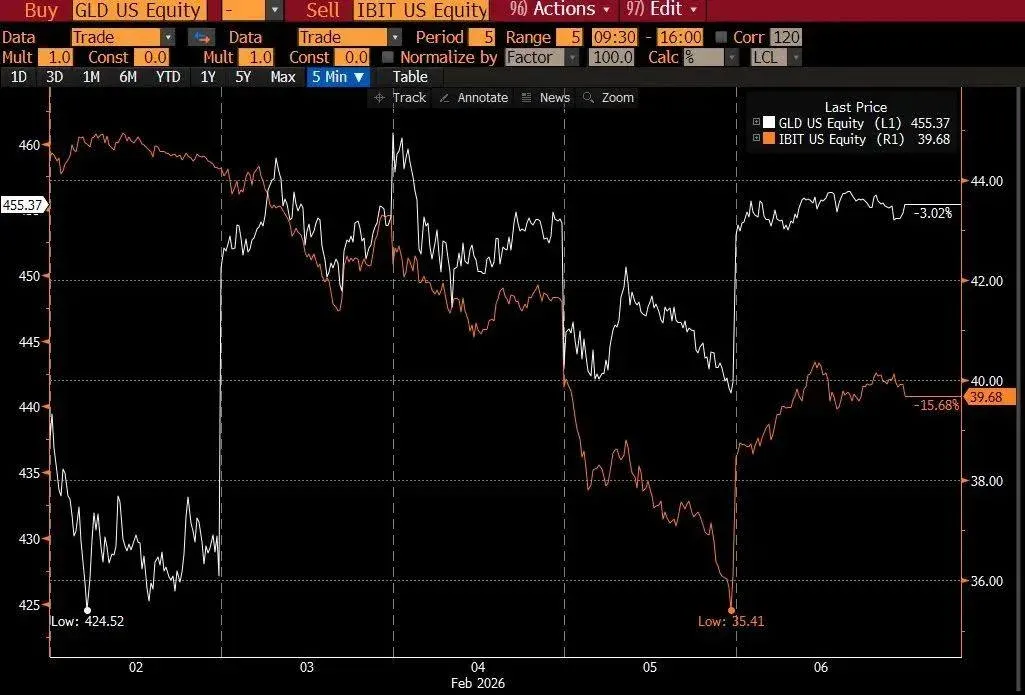
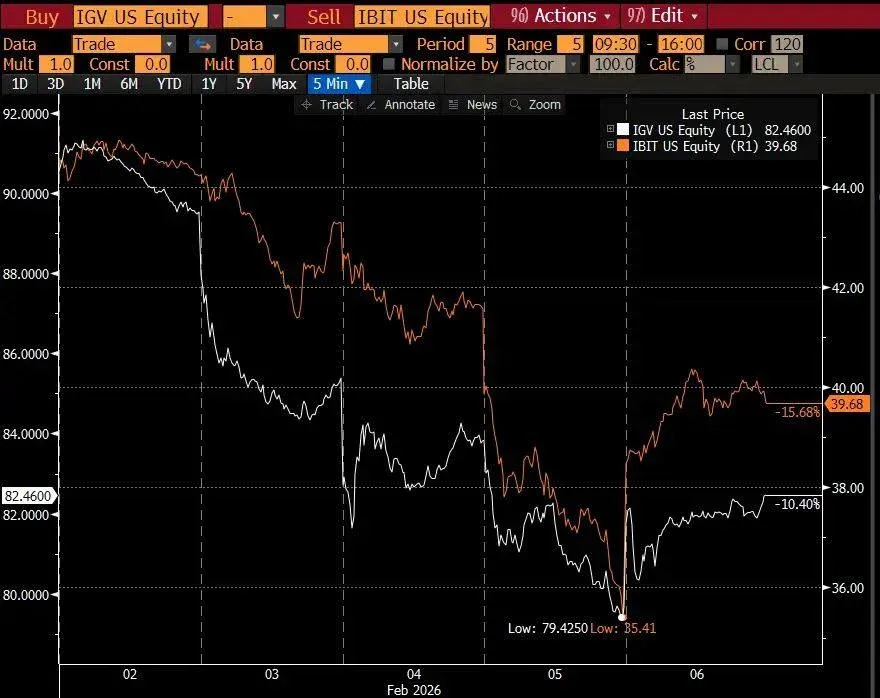
This further underscores that the multi‑strategy fund ecosystem was at the heart of the turmoil.
The Role of Basis Trades
CME’s Bitcoin basis trades are a standard hedging tool for multi‑strategy funds. Data from January 26 to February 5 show that the near‑month basis jumped from 3.3 % to 9 % on February 5—the largest single‑day rise since the ETF launch—clearly pointing to massive forced liquidation of basis positions on that day.

Take institutions such as Millennium or Citadel as examples: being compelled to unwind basis exposures (selling spot Bitcoin while buying futures) would have a pronounced impact on the overall market structure.
Common‑Owner Risk Among Hedge Funds
U.S.‑based multi‑strategy hedge funds often employ delta‑hedging, relative‑value (RV), or factor‑neutral strategies. Rough estimates suggest that about one‑third of Bitcoin‑ETF shares are institution‑held, with roughly 50 % of those belonging to hedge funds. If financing costs or margin requirements rise, these funds can liquidate quickly, funneling capital into a single exit point under stressed liquidity—creating a “closure risk.” This phenomenon aligns with the capital‑flow patterns we observed in the ETF data.
Structured Products as Accelerants
Although the aggregate size of structured products is insufficient to spark a sell‑off on its own, they can act as catalytic accelerants when multiple risk factors converge. For instance, a structured note with a knock‑in put barrier that activates once Bitcoin breaches a critical price level can push the option’s Delta above 1. In a negative‑Vanna environment, dealers are forced to aggressively sell the underlying, further depressing prices.
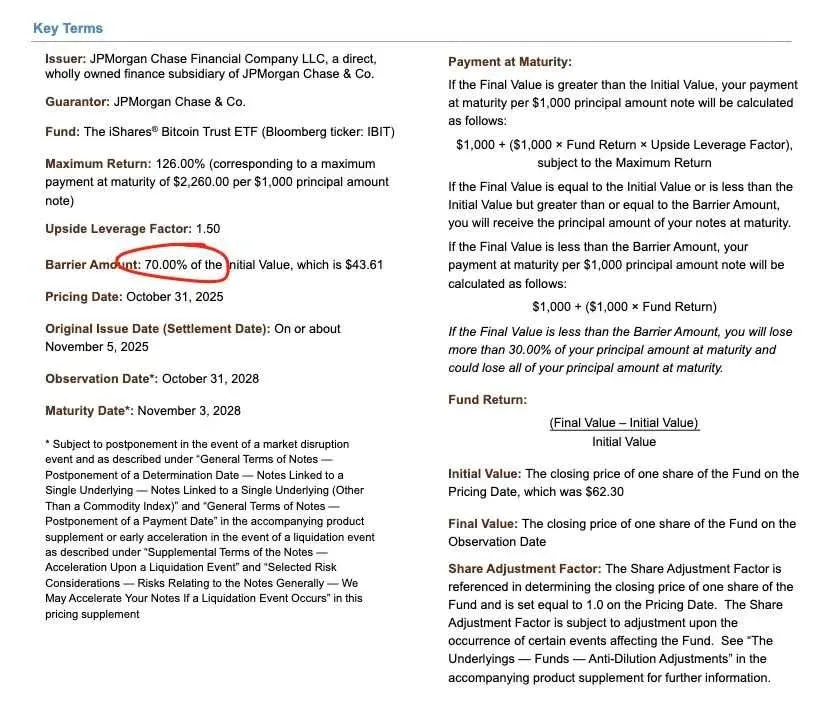
During the negative‑Vanna phase, implied volatility (IV) briefly approached 90 %, a historic extreme, prompting dealers to expand their short position in IBIT and ultimately creating the observed net increase in ETF shares.
Amplification Effect of Short‑Gamma Positions
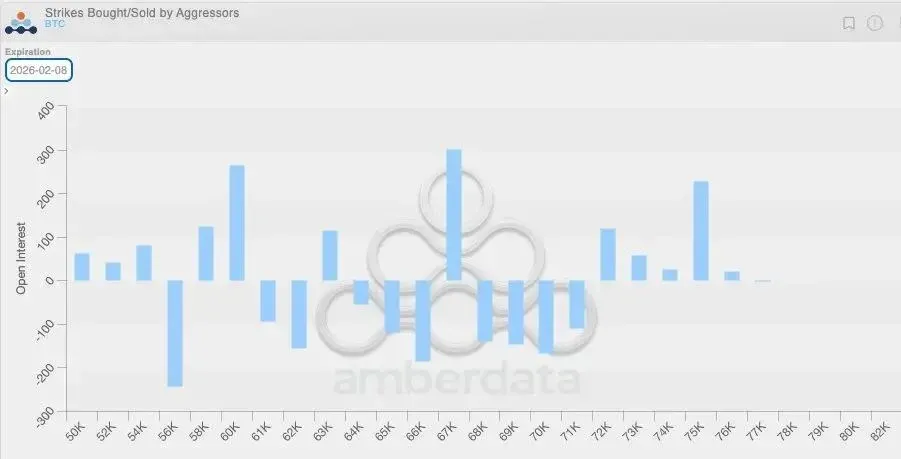
Recent low overall volatility led crypto‑market participants to load up on put options, leaving dealers in a natural short‑Gamma stance. When a sharp move materializes, this structural imbalance is magnified. The chart below shows that, in the $64,000 – $71,000 range, dealers’ holdings were heavily concentrated in short‑Gamma put positions.
The February 6 Rebound
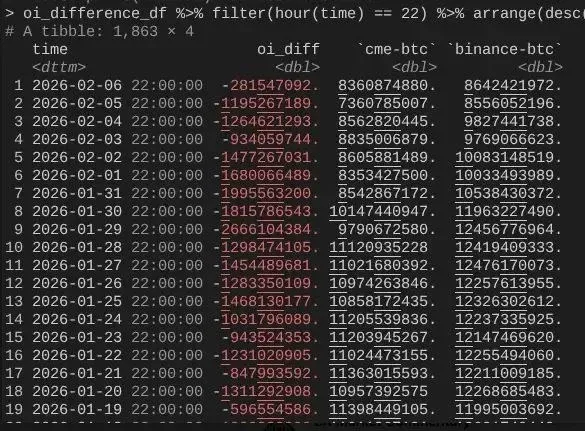
On February 6, Bitcoin staged a >10 % rally. Simultaneously, CME open‑interest (OI) expanded at a markedly faster pace than Binance’s OI. The sharp collapse of CME OI on February 4‑5 validates the earlier assessment that basis trades were liquidated on February 5; by February 6, many of those positions appear to have been re‑established to exploit the higher basis, thereby offsetting the pressure from capital outflows.
Closing the Logical Loop
IBIT’s subscription and redemption figures were essentially balanced because CME basis trading had resumed; however, the price remained low due to the pronounced collapse of Binance OI, indicating that part of the deleveraging pressure originated from native‑crypto market short‑Gamma positions and forced liquidations.
The foregoing provides a comprehensive explanation of the market dynamics on February 5 and the subsequent February 6 rebound. While the narrative rests on several assumptions and does not pinpoint a single “culprit,” the core conclusion is clear: the spark for this sell‑off came from risk‑off behavior in traditional finance, which triggered a demand for short‑Gamma hedges and accelerated Bitcoin’s decline, only for the process to reverse sharply on February 6. The move was not driven by a directional bearish bet but by a cascade of hedging requirements.
Regarding the alleged link to the 10/10 incident, I disagree that it represents a continuation of the current deleveraging cycle. One article attributed the turbulence to a Hong‑Kong‑based fund conducting yen‑carry trades, but that explanation has two major flaws: (1) a non‑crypto prime broker is unlikely to provide the sophisticated multi‑asset services and a 90‑day margin buffer described; (2) if the carry‑trade capital escaped via IBIT‑option purchases, Bitcoin’s drop would not have accelerated risk release, because those options would have become out‑of‑the‑money, with Greeks collapsing to zero.
The next few days will be pivotal; additional data will allow us to assess whether investors are using the dip to build fresh demand. A clear net inflow would be a bullish signal. At present, I remain cautiously optimistic about potential ETF inflows and will watch especially for net inflows that are not accompanied by expanding basis trades.
Note for readers: Cryptocurrency gains may be taxable in your jurisdiction; please consult a tax professional.
For U.S. residents: Trading on the global Binance platform is not available; use Binance.US or another regulated U.S. exchange.
Fiat conversions: All fiat references in this article are expressed in US dollars (USD), and cross‑border transfers should follow SEPA or SWIFT protocols where applicable.
In sum, the series of observations underscores that Bitcoin has become deeply embedded in the global financial‑capital ecosystem in a highly sophisticated and mature manner. When the market sits on the opposite side of a squeeze, upside moves can be steeper than ever before. The fragility of traditional‑finance margin rules is precisely the source of Bitcoin’s antifragility; once prices rebound—especially after the Nasdaq raises the cap on open‑interest for options—we may witness a spectacular rally.
---
This article introduced “The Black Swan Was Actually This: The Real Reason Behind the Recent Bitcoin Crash.” For more pieces dissecting Bitcoin’s price drops, search for Bitaigen (比特根) or continue scrolling below. Thank you for your continued attention and support.
Related Reading
- Bitcoin Address Guide: How It Works, Formats & Creation
- Bitcoin at $65k, Ethereum $3.1k, TON tops Dogecoin
- Bitcoin Halving 2024 Done – Next Halving Timeline & Impact
💡 Register on Binance with referral code B2345 for the maximum trading fee discount. See Binance complete guide.



