
Binance data shows that liquidity is shifting and traders’ positions are changing, factors that could underpin Bitcoin’s next price wave.

The next major breakout for Bitcoin (BTC) may depend on the current flow of funds on the Binance exchange and the dynamics of its derivatives market.
At present, on‑chain data from the world’s largest cryptocurrency exchange indicate a cooling of whale deposits, an increase in Bitcoin withdrawals, and a continuously expanding share of futures trading. These trends could influence Bitcoin’s future price trajectory.
By analysing Binance on‑chain data, we examine the latest shifts in Bitcoin fund flows and derivatives structures. This article focuses on three key technical charts, helping readers identify potential market turning points and layout ideas, and is worth a thorough read. Combined with a macro view of liquidity migration, we also provide practical reference points.
Whale activity retreats after the February surge
Binance (official download: download | official registration: register) measures whale activity by the ratio of the top‑10 deposits to the exchange’s total deposits. In early February this ratio spiked above 0.60, indicating strong selling pressure from large holders.
Since then, the 14‑day moving average has fallen back to around 0.45, re‑entering the overall range observed in 2024‑2025. The reduction in large‑deposit spikes suggests that, for now, the dominant selling inflow to Binance has cooled.
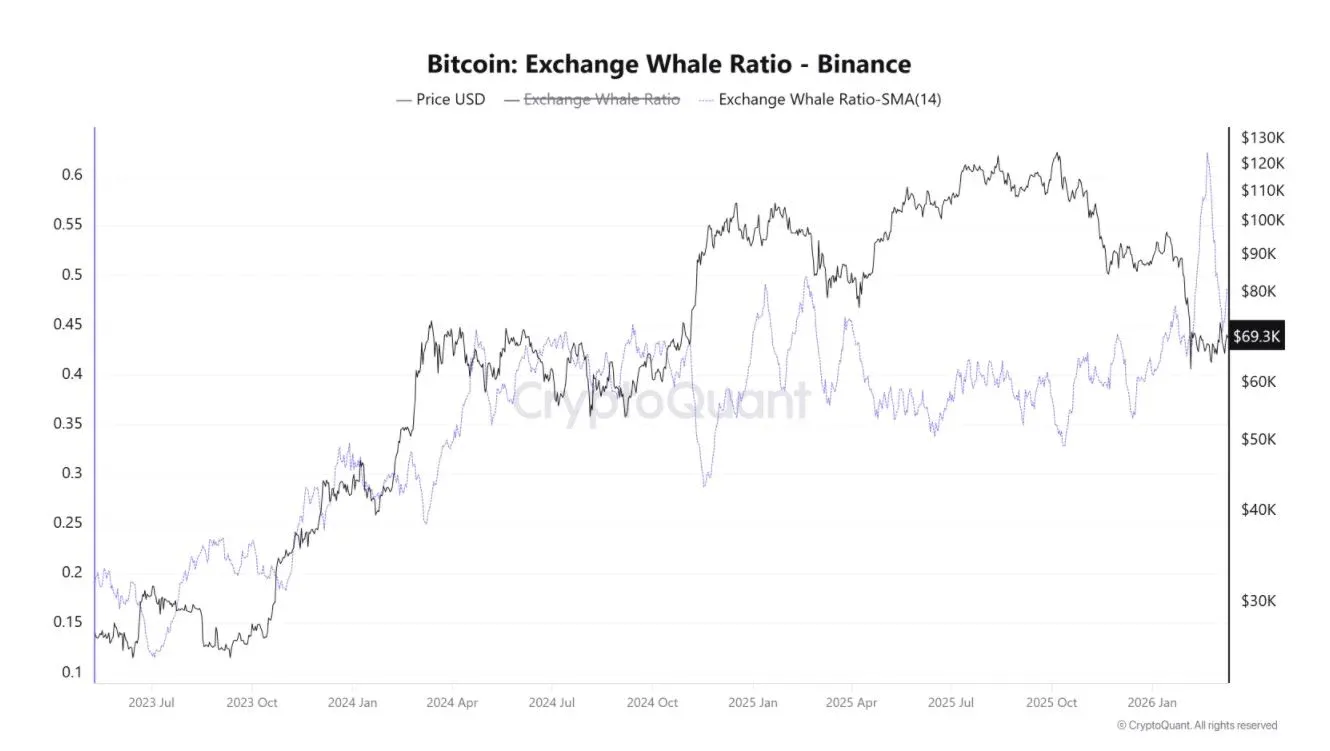
The price action during the same period also warrants attention. After the February correction, Bitcoin stabilized in the $65,000 – $72,000 range and did not experience further declines.
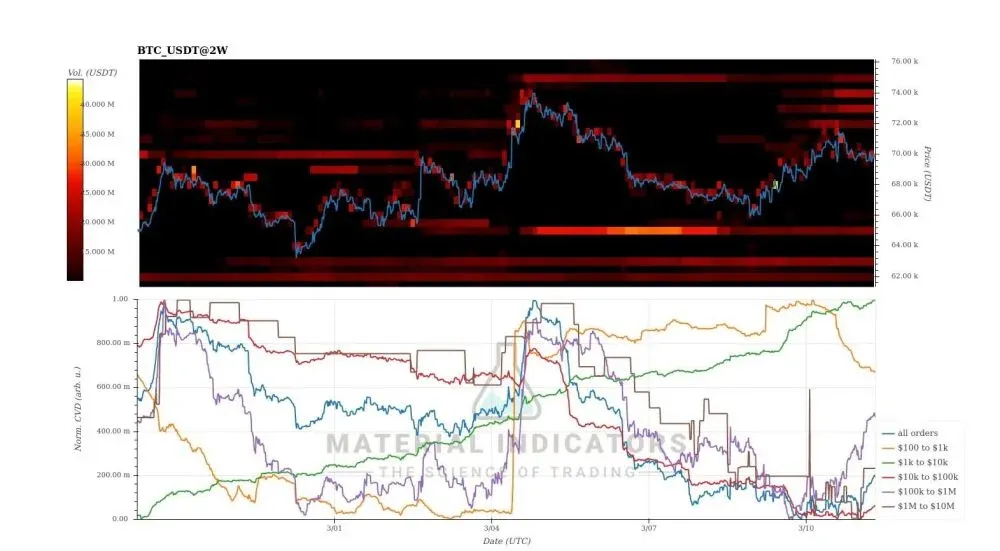
Crypto analyst CW notes that some whales are still buying. The Cumulative Volume Delta (CVD) indicator for Bitcoin shows that, during the recent consolidation, whales maintained a net buying stance.
CVD tracks the net difference between aggressive market‑price buys and sells. When price is sideways and the indicator stays at a relatively high level, it may imply that large capital is absorbing market supply, even though the price has not moved sharply upward.
Binance BTC withdrawals rise while futures dominate spot trading
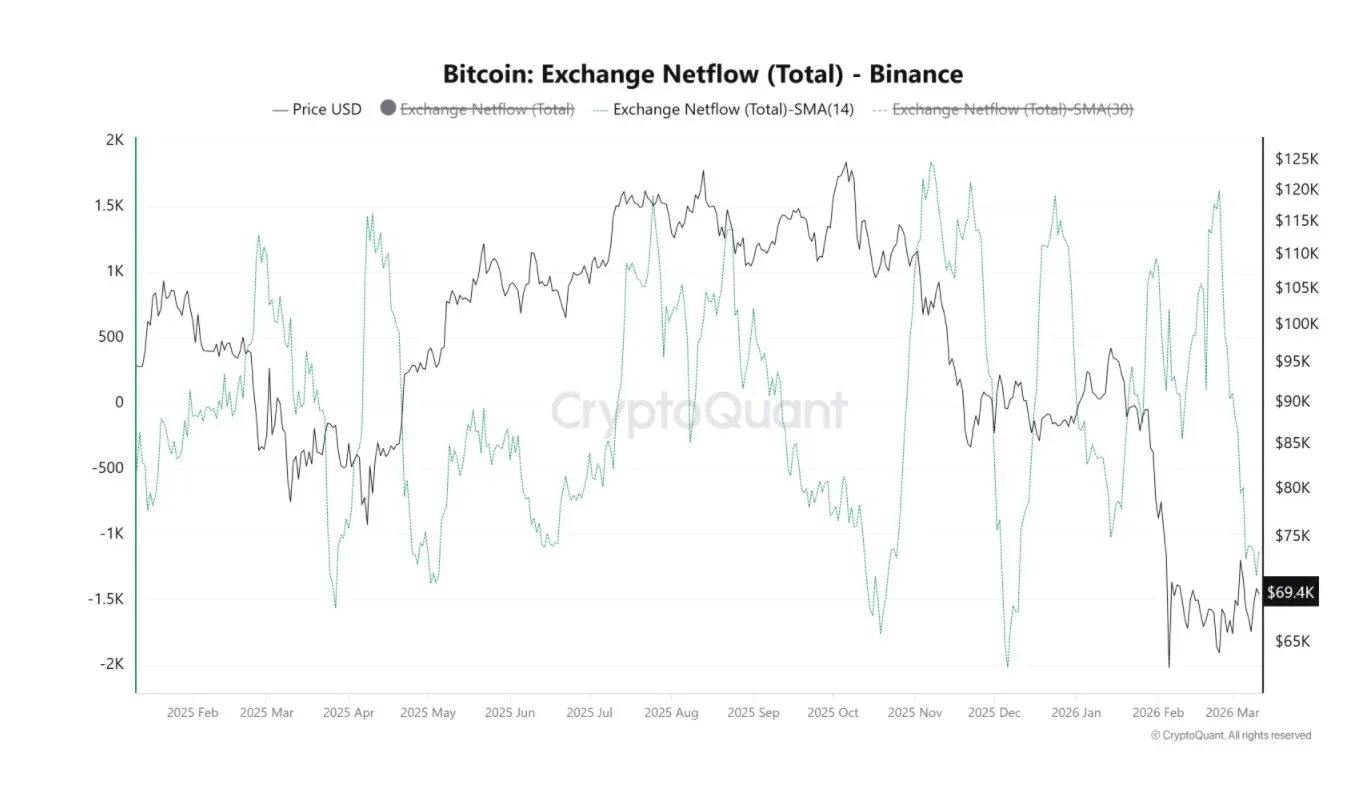
Since mid‑February, Binance’s net inflow to the exchange has also shifted. Net inflow measures the difference between the amount of BTC entering and leaving the platform.
As of March 11, the 14‑day moving average turned negative to ‑1,151 BTC, indicating a sustained outflow of Bitcoin from the exchange. In other words, more BTC are being withdrawn, reducing the amount of immediately sellable supply on‑exchange.
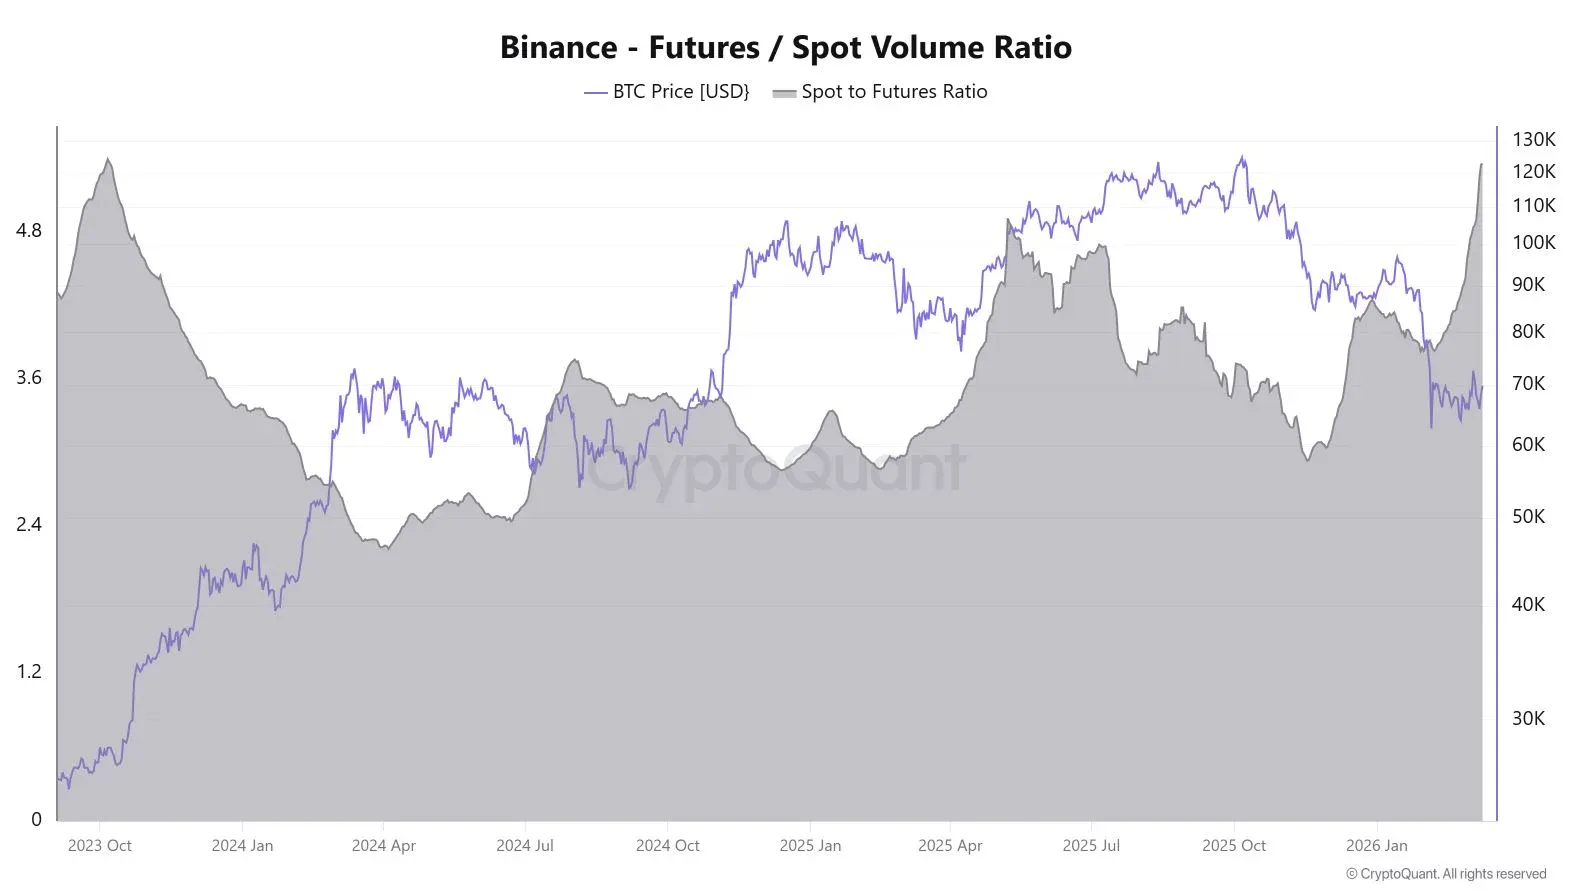
At the same time, trading volume in the derivatives market has expanded in lockstep. Crypto analyst Maartunn points out that the ratio of Binance futures to spot volume has climbed to roughly 5.3, a peak not seen since October 2023. This means futures turnover now exceeds spot turnover by more than five times. The sharp rise in futures activity suggests traders are leveraging more heavily, preparing for potential Bitcoin price swings.
Coinbase research indicates that spot demand is warming up. The exchange reports that the Short‑Term Realized Profit Ratio (SOPR) for short‑term holders has been steadily climbing since the end of February. Analysis shows SOPR for both Bitcoin and Ethereum (ETH) has risen above 1, implying that recent demand is sufficient to absorb selling pressure from new entrants, helping to keep BTC within its current range.
These factors shed light on the deeper reasons behind Bitcoin’s recent consolidation. If BTC can firmly establish $70,000 as a support level, it may trigger a re‑evaluation of the price structure upward.
Conversely, if the price fails to break the $72,000 resistance in the coming days or weeks, the market could confirm a “bull‑trap,” and history suggests a subsequent pull‑back may follow.
Note for U.S. readers: Access to Binance’s global platform is restricted in the United States; you should use Binance.US for trading.
Fiat considerations: Deposits and withdrawals in fiat are typically handled via USD, SEPA, or SWIFT transfers.
Tax disclaimer: Cryptocurrency gains may be taxable in your jurisdiction; please consult a tax professional for guidance.
This concludes the detailed analysis of the three Bitcoin (BTC) chart patterns that outline the technical layout for the next major market move. For more information on Bitcoin chart patterns and technical layouts, stay tuned to Bitaigen’s other articles!
💡 Register on Binance with referral code B2345 for the maximum trading fee discount. See Binance complete guide.


