

We approach the story from a macro perspective, outlining the core take‑aways of this week’s oil‑price shock, U.S. inflation data, and Bitcoin technical‑analysis cross signals. By digging into supply‑demand dynamics and policy moves, we aim to help readers gauge possible market directions. The following sections will unpack each point in detail, so a careful read is recommended.
Oil‑Price Volatility and the U.S. Inflation Focus
The spotlight on U.S. macro data this week is expected to be higher than usual, mainly because geopolitical tension is feeding inflation warnings. The Consumer Price Index (CPI) for February and the Personal Consumption Expenditures (PCE) data for January—delayed in release—are due soon, and the U.S. Q4 GDP figures will also be revised this week.
Although the Federal Reserve prefers PCE as its core‑inflation gauge, the market’s immediate focus remains on the CPI, which is especially sensitive to oil prices. With oil shipments through the Strait of Hormuz still disrupted, February’s CPI may not fully reflect this latest shock, and January’s CPI even came in below expectations.
Kobeissi Letter commentary notes that the closure of the Strait of Hormuz is one of the largest supply interruptions in history.
“The current supply shock is roughly equivalent to the cumulative impact of the past 2‑6 emission points,” with calculations showing a daily shortfall of more than 20 million barrels.
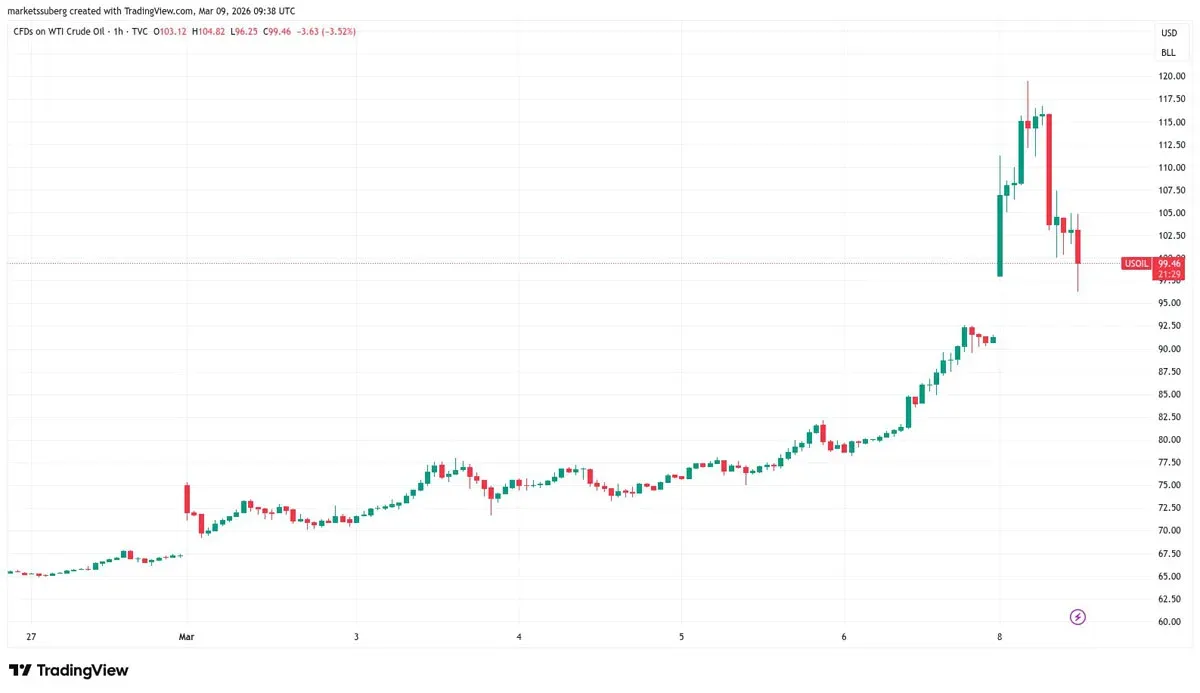
Nevertheless, on Monday the G7 announced an emergency release plan for up to 400 million barrels of strategic reserves, and oil prices retreated in the subsequent trading session. U.S. crude attempted a historic reversal at 10:30 p.m. ET, briefly spiking more than 30 %.
Mosaic Asset Company, in its *Market Mosaic* newsletter, further warned that rising oil‑and‑gas prices can suppress consumer spending and intensify inflation pressure, making the Fed’s monetary‑policy outlook even more uncertain. The firm also recalled that when CPI peaked at 9 % in 2022, commodity prices experienced a similarly sharp rally.
---
Latest Developments on Bitcoin’s Death‑Cross
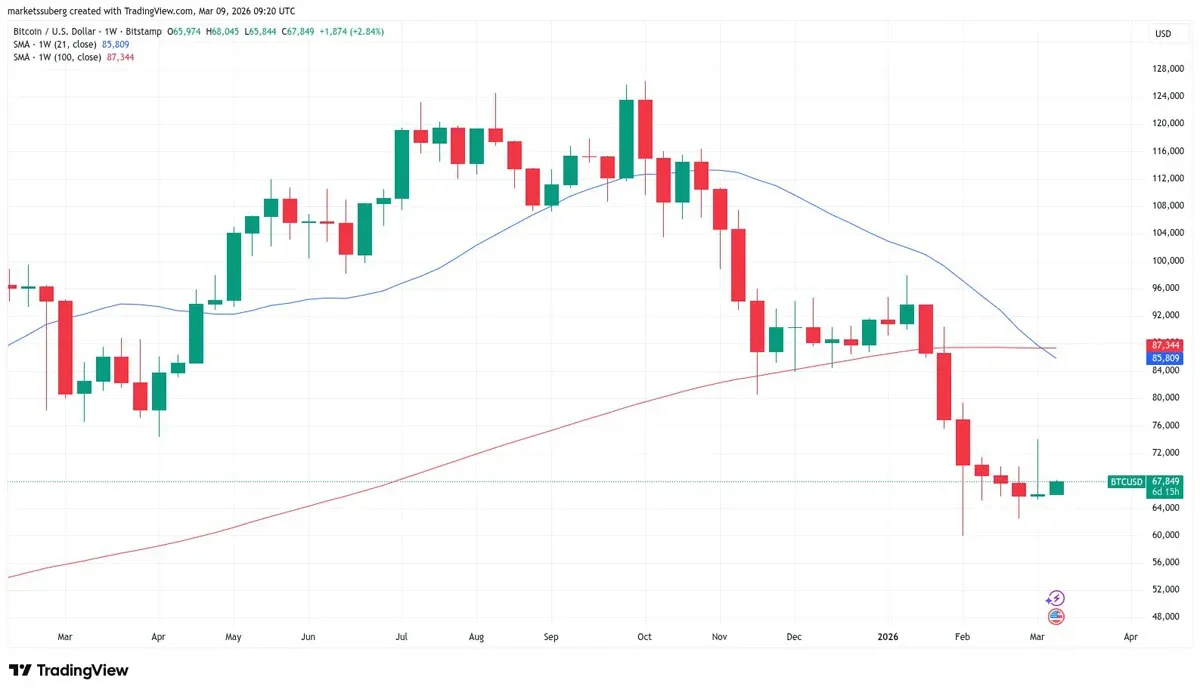
Starting this week, Bitcoin’s price chart again displayed a technical warning. The 21‑week simple moving average (SMA) fell below its 100‑week equivalent position at the end of the week, forming the classic bearish “death‑cross.” This signal suggests that Bitcoin could remain under pressure in the coming sessions.
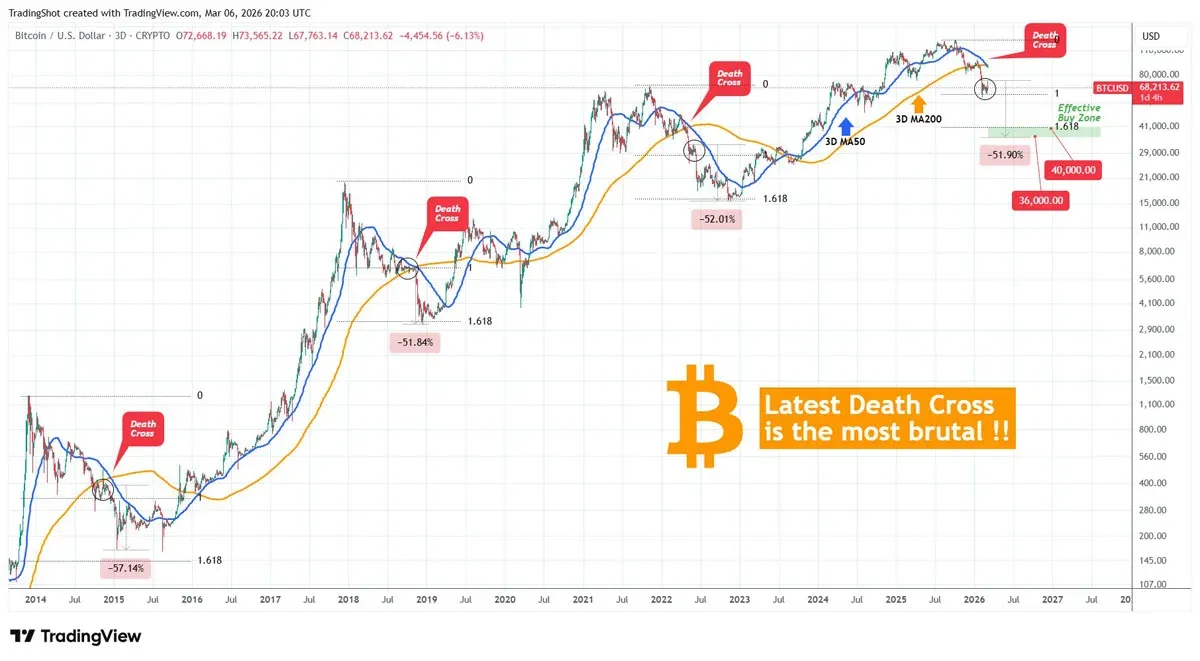
Material Indicators co‑founder Keith Allen warned last week that, without a strong bullish catalyst, this cross is likely to herald the start of the next down‑trend. At the same time, market participants are watching for a potential death‑cross between the 50‑period and 200‑period moving averages on the three‑day chart.
Trading platform TradingShort recently published an analysis stating that if a bearish death‑cross appears on a three‑day timeframe, Bitcoin could drop roughly 50 %. The firm added that in two of the last three bear markets, Bitcoin formed a 1.618 Fibonacci extension after the death‑cross, implying a pull‑back into the $40,000‑$36,000 range.
---
Subtle Shifts in Market Sentiment and Derivatives Momentum
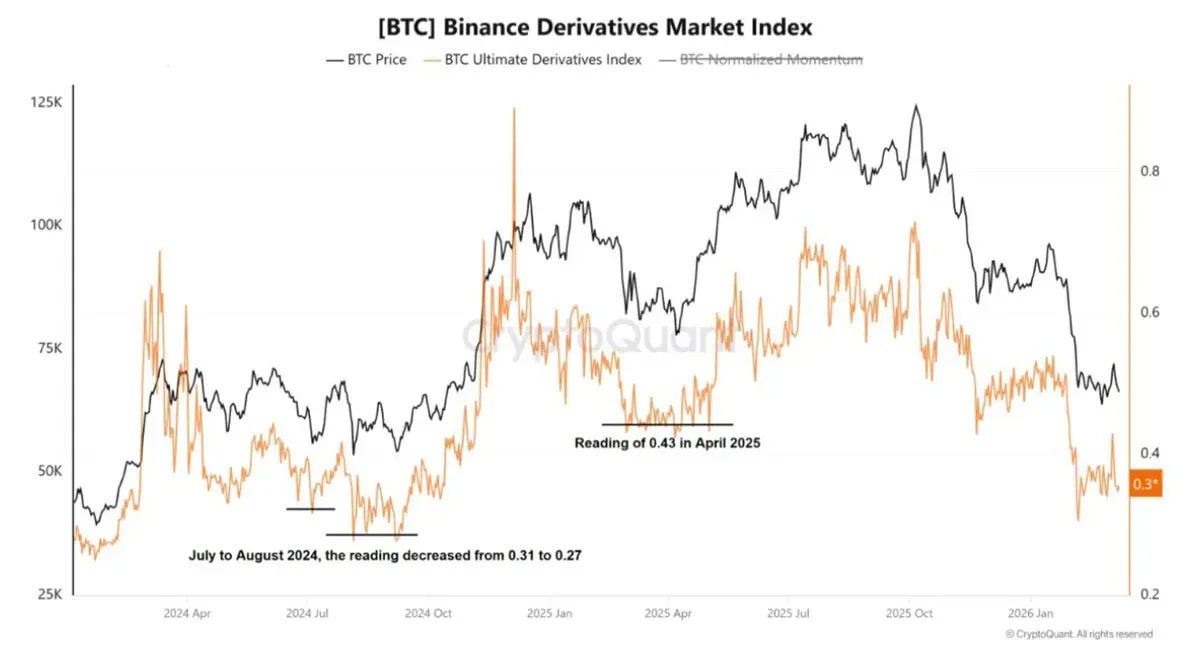
When hunting for possible reversal signals, on‑chain analytics platform CryptoQuant this week offered a few bullish clues for long‑term holders. The platform disclosed that the Binance derivatives market index has recently shown an upward tick, currently reading around 0.35—near the levels seen in July‑August 2024 and below the 0.43 recorded in April 2025.
CryptoQuant researcher Amr Taha wrote in a *Quicktake* blog post that historically similar index levels tend to appear at major Bitcoin market bottoms, after which prices gradually climb to new highs. While he cautioned that the present weakening momentum could produce a trend different from past cycles, the signal remains worth watching.
---
The “Boring Bear Market” Meets Macro Forces
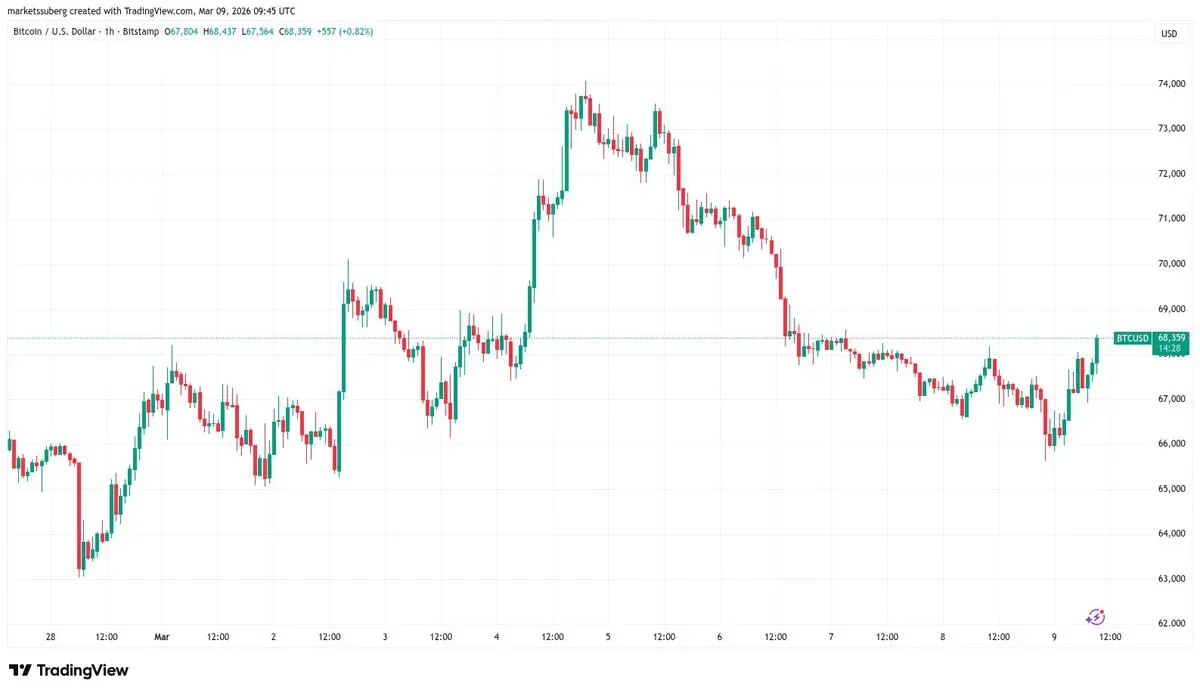
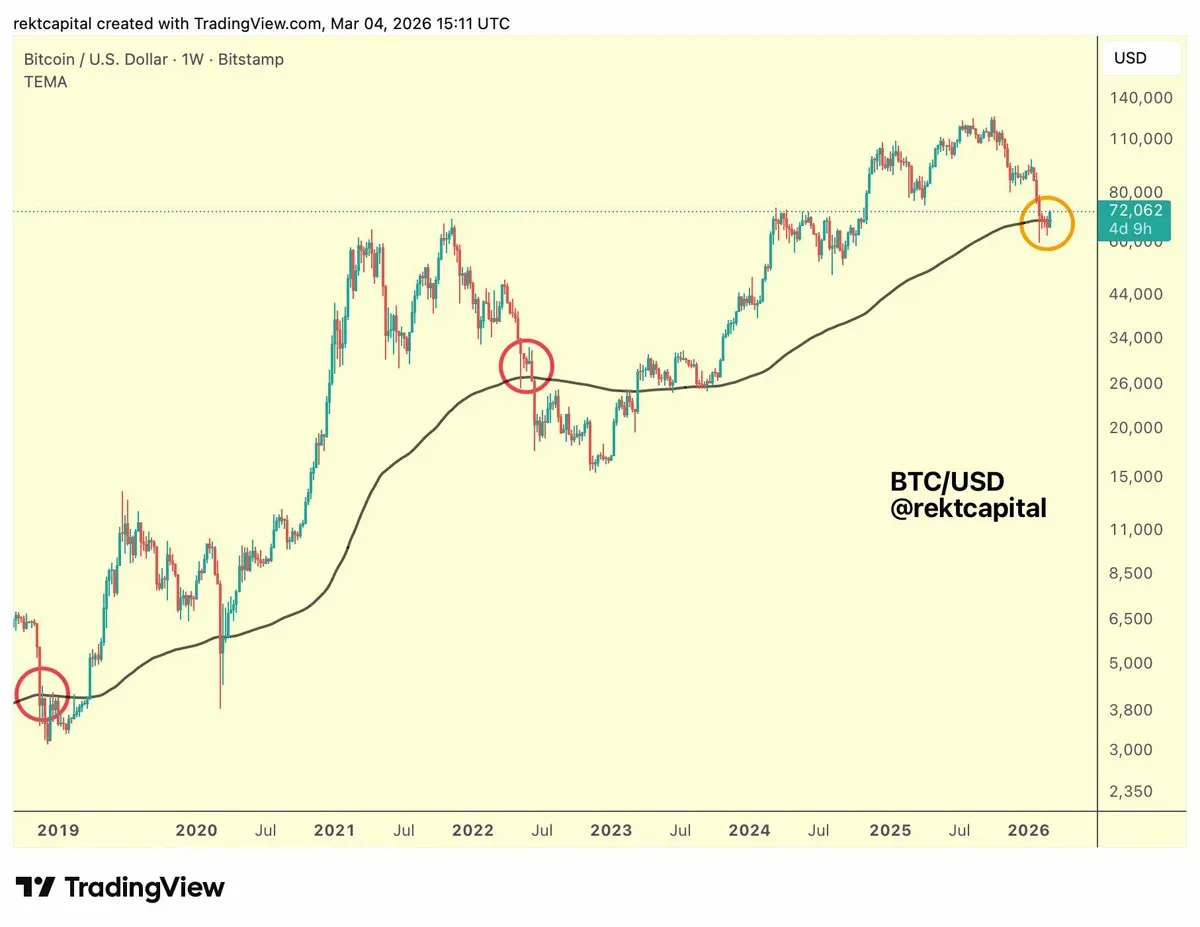
Bitcoin’s early‑week action can be described as a “boring bear market.” Elevated tensions in the U.S.–Iran conflict pushed market sentiment toward caution, and BTC/USD on Bitstamp closed near $65,600. TradingView data later showed a brief rebound, but it was insufficient to prevent the weekly close from slipping below a key long‑term trend line—the 200‑week exponential moving average (EMA).
Cointelegraph reported that the 200‑week EMA is often viewed as a crucial support level in bear markets; its breach signals further downside potential. Trader‑analyst Rekt Capital posted on X: “The 200‑week EMA still caps the price unless contrary evidence emerges.”
Rekt Capital further explained that, amid Middle‑East volatility, risk assets experienced heightened swings, pushing Bitcoin down to roughly $74,000. Another X user, Jelle, added: “The deviation led to a rapid weekend sell‑off. Our view stays the same—this is still a boring bear market.”
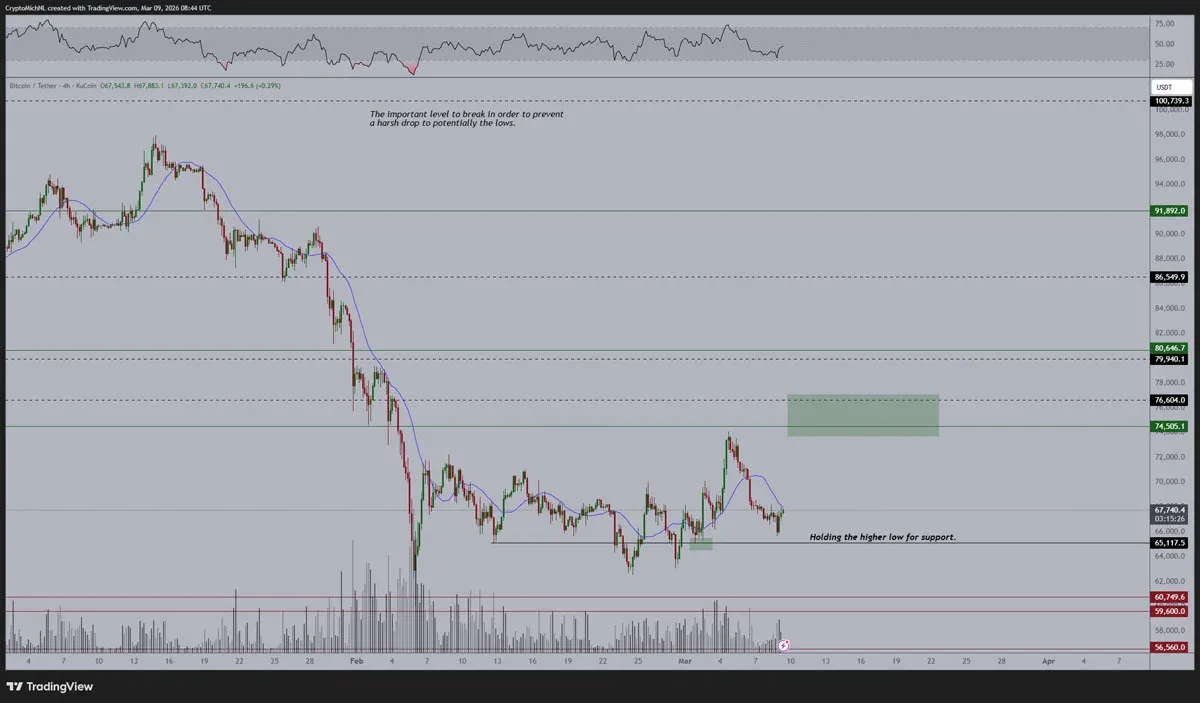
Crypto analyst and entrepreneur Michaël van de Poppe offered a different perspective, arguing that Bitcoin remains range‑bound and relatively resilient. Facing a 15 % oil‑price jump on Monday—the highest since 2022—while gold and commodities fell and the Nasdaq slumped sharply, he wrote on X: “In this macro environment, Bitcoin’s range‑bound behavior is actually pretty solid.”
Cointelegraph further noted that, in the long run, Bitcoin’s price forecast still leans toward a macro‑level bottom, potentially retreating to $50,000 or lower.
---
Latest Whale Activity
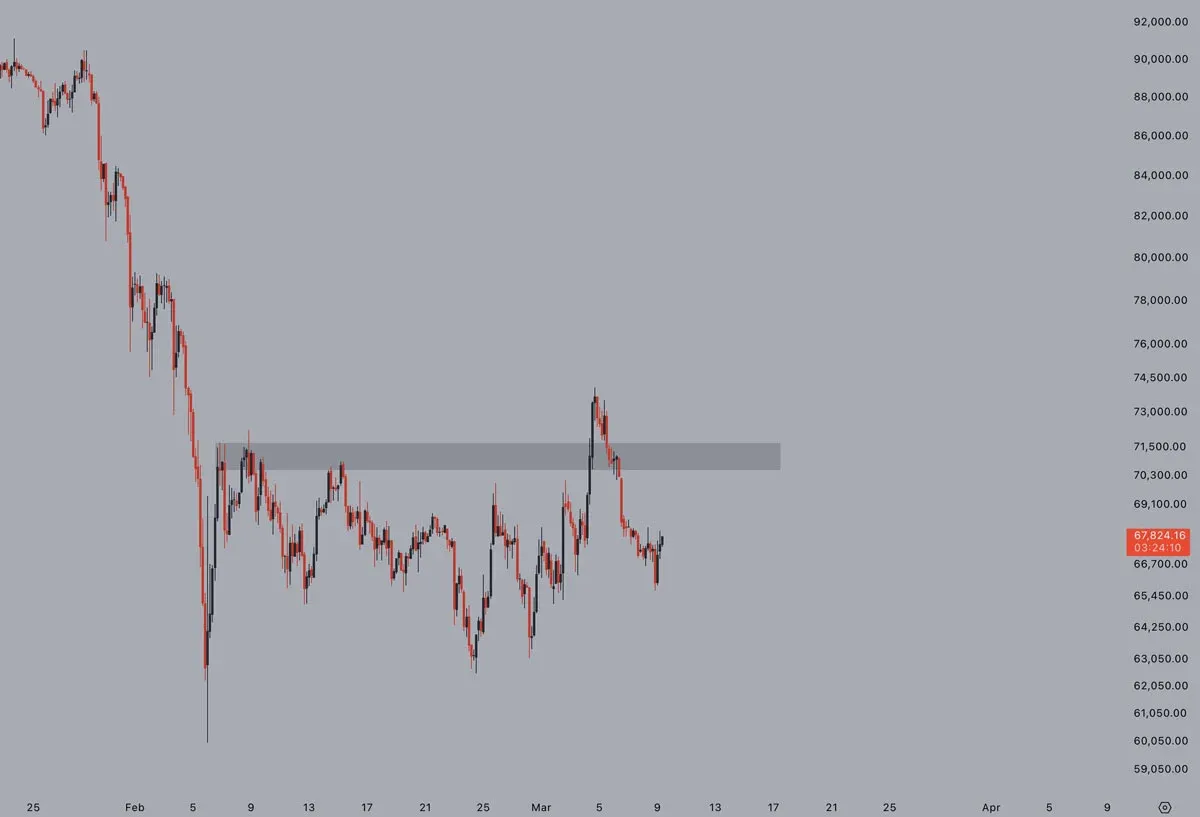
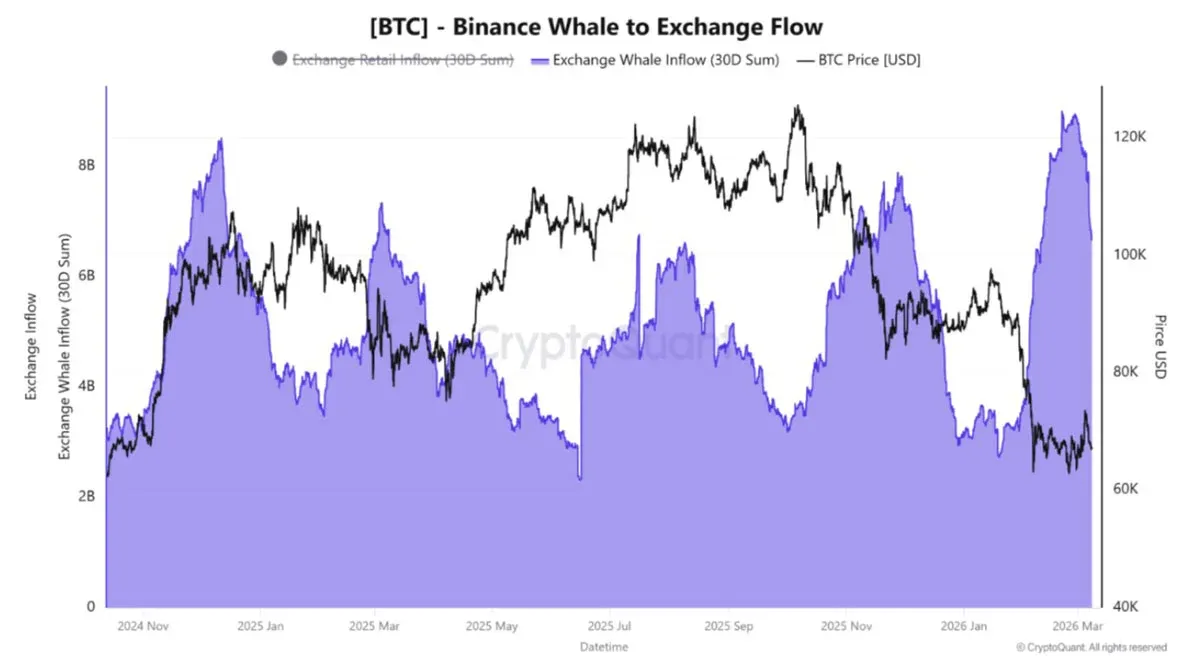
After BTC/USD breached $70,000 last week, the profit‑taking impulse among large‑holder “whales” appears to have cooled. CryptoQuant data shows that between March 1‑8, whale inflows dropped from $8.8 billion to $6.6 billion, indicating that even while price oscillated between $65,000‑$72,000, institutional participants did not markedly increase exchange deposits.
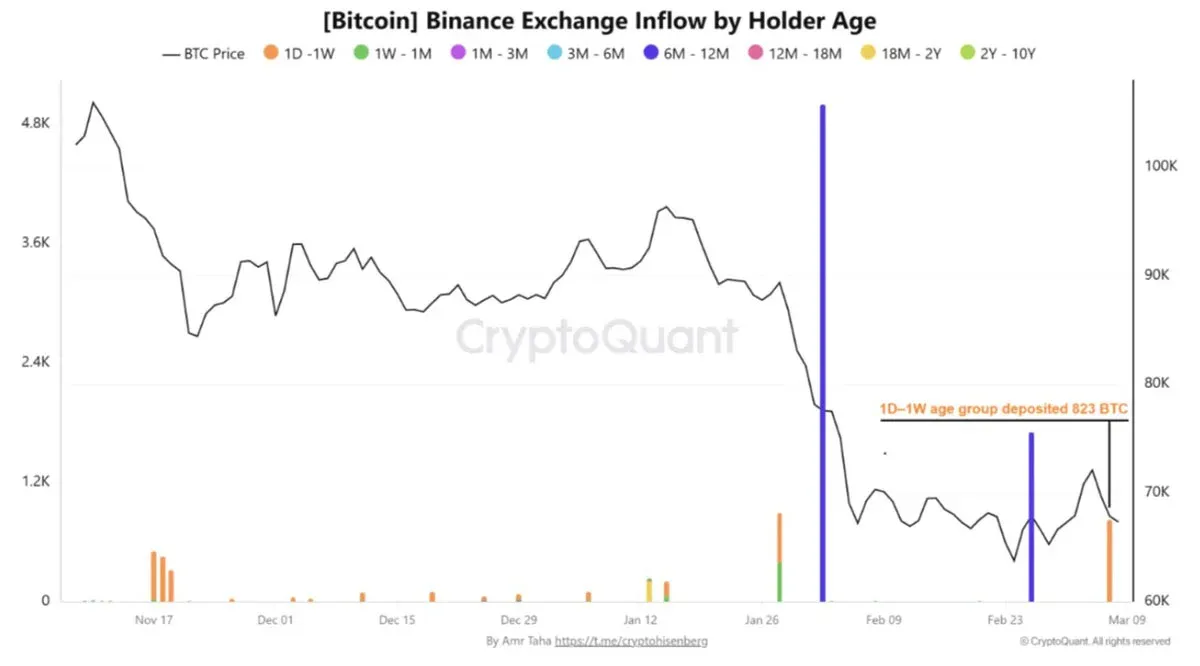
On March 7, Binance saw a surge in inflows, largely stemming from coins that had been moved in the prior week—a pattern contrasting with February’s inflow dynamics, when long‑dormant coins returned to Binance wallets. Taha explained that such movements are often interpreted as a shift in sentiment among a subset of investors, some possibly preparing to sell or hedge positions.
“Deposits of older coins sometimes reflect growing caution or pessimism in certain market segments.”
---
Weekly Bitcoin Recap
- Oil Shock: Supply disruption in the Strait of Hormuz combined with the G7’s strategic‑reserve release plan are shaping U.S. inflation expectations.
- Death‑Cross: The cross of the 21‑week SMA below the 100‑week SMA, plus the potential three‑day death‑cross, heightens downside risk.
- Derivatives Momentum: The Binance derivatives index has slipped toward historic bottom levels, hinting at a possible bottom‑bounce.
- “Boring Bear Market”: The 200‑week EMA was breached, with price hovering between $65,600 and $74,000.
- Whale Behavior: Large holders remained cautious above $70,000, and inflow volumes have declined.
These constitute the five major points on how oil shocks and the death‑cross are jointly influencing Bitcoin (BTC) this week. Stay tuned to Bitaigen (比特根) for further updates.
Disclaimer: Cryptocurrency gains may be taxable in your jurisdiction; consult a tax professional for advice. For U.S. users, trading on Binance must be done through Binance.US, while global users can access the main Binance platform via SEPA, SWIFT, or other fiat on‑ramps.
💡 Register on Binance with referral code B2345 for the maximum trading fee discount. See Binance complete guide.


