
We examine SOL’s recent price structure and potential drivers from three dimensions: technical analysis, capital flows, and industry perspectives. The article focuses on the interaction of key moving averages, the SuperTrend indicator, and Fibonacci zones, while incorporating the latest ETF inflow data and viewpoints from industry leaders to help assess upcoming support and resistance levels. Continue reading to understand the logic behind SOL’s future price movements.
Solana Price Forecast: Backpack CEO Backs SOL, Stock Tests the $93 Breakout Barrier — 2026‑03‑25
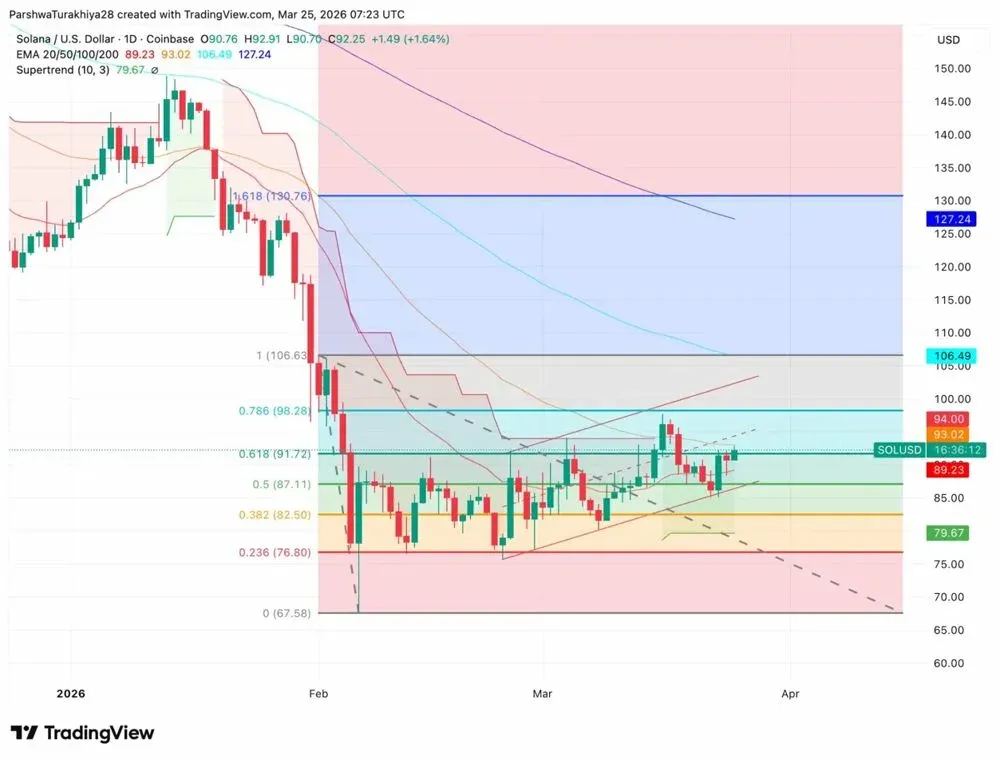
- At the close on March 25, SOL was priced at $92.25, up 1.64 %, sitting between the 0.5 and 0.618 Fibonacci zones on the daily chart.
- On the same day, the U.S. SOL spot ETF recorded a net inflow of roughly $4.64 million, bringing the cumulative net inflow to nearly $994.43 million.
- The Backpack chief executive publicly stated that Solana is the only crypto project that must be on a network today, calling it the most liquid DeFi market worldwide.
On the 2‑hour chart, SOL continues to trade inside a descending channel, while the daily chart is pressured by four exponential moving averages (EMAs). The gradual recovery of ETF capital provides fundamental support for the price, but without a clear breakout the trend remains weak.
Key Technical Indicators
- Four EMAs (all bearish): 20‑day EMA = $89.23, 50‑day EMA = $93.02, 100‑day EMA = $106.49, 200‑day EMA = $127.24.
- SuperTrend line: positioned at $79.67, now acting as support and representing the only bullish signal on the daily chart.
- Fibonacci zone: 0.5 support = $87.11, 0.618 resistance = $91.72, 0.786 target = $98.28, full retracement level = $106.63.
If the daily close breaches $93.02 (the 50‑day EMA), an upward channel may open; conversely, a drop below $87.11 could see the price fall back to $79.67 and possibly further to the $67.58 region.
2‑Hour Chart Details
- Upper channel boundary: around $93.94. A close above this level would move the price into R4 ($93.12) and eventually target R5 ($98.94).
- Mid‑point support: $90.89.
- Lower support: $84.74, which defended the low recorded on March 22.
ETF Capital Flows and Institutional Views
As of March 24, the SOL spot ETF had accumulated a net inflow of $994.43 million, with total net assets of $881.53 million. Bitwise’s BSOL led single‑day inflows with $2.97 million, followed closely by Franklin’s SOEZ. Since mid‑March, net outflows have been essentially zero, indicating that institutional holdings are stabilizing.
The Backpack CEO emphasized this week that if a project must choose a base layer, Solana is the sole choice because it already hosts a deep, highly competitive on‑chain capital market and boasts the strongest DeFi liquidity globally.
Possible Market Paths
- Bullish scenario: A 2‑hour close above $93.94, followed by a breach of the 50‑day EMA ($93.02) with volume expanding in tandem. The first target would be the 0.786 Fibonacci level at $98.28, followed by the full retracement level at $106.63. Should cumulative ETF inflows surpass $1 billion, upward momentum could receive an additional boost.
- Bearish scenario: If price stalls at the channel top and retreats below the 20‑day EMA ($89.23) and further below $87.11, the first support zone becomes $82.50 (the 0.382 Fibonacci level), with a deeper defensive line at $79.67. A break of that level could see the price test the February low around $67.58.
---
Executive Summary
Solana (SOL) remains one of the leading first‑layer blockchains in terms of technology and rapid growth. It focuses on high throughput, low latency, and strong composability, offering a scalable foundation for DeFi and consumer‑grade Web3 applications.
As of October 2025, SOL trades around $204, having rebounded strongly from the 2022‑2023 trough and re‑entering the global top‑10 crypto assets. Its ecosystem spans DeFi, NFTs, gaming, social finance, and payments, supported by over 2,500 active developers, with on‑chain transaction activity continuously rising.
This piece delves into Solana’s underlying technology, market dynamics, competitive advantages, potential risks, and scenario‑based price forecasts for 2025‑2030.
---
Project Overview – What Is Solana and How Does It Work?
Solana was launched in 2017 by Anatoly Yakovenko and the Solana Labs team to overcome the scalability limits of early chains such as Ethereum. Its core innovation lies in the fusion of Proof‑of‑History (PoH) with Proof‑of‑Stake (PoS), creating a hybrid consensus mechanism that timestamps each transaction without sacrificing decentralization, thereby dramatically increasing throughput.
Core Features
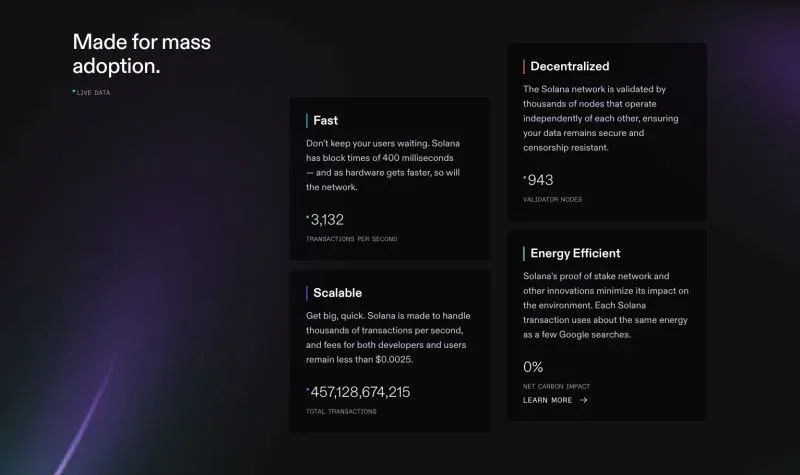
- Extremely high TPS: Under normal network conditions the chain can reliably handle 2,000‑4,000 transactions per second, with theoretical peaks exceeding 50,000 TPS.
- Micro‑fee structure: A single transaction costs roughly $0.0002, making Solana well‑suited for micropayments, gaming, and other high‑frequency use cases.
- Monolithic global state: A unified on‑chain state enhances composability between DeFi and NFT projects, eliminating the need for cross‑chain bridges.
- Vibrant developer community: The foundation fuels growth through hackathons, grant programs, and other incentives, keeping Solana among the world’s largest open‑source Web3 ecosystems.
- Ecosystem extensions: Projects such as Solana Pay and the Saga smartphone bring blockchain functionality to mobile payments and consumer applications.
The design philosophy centers on speed, scale, and simplicity; even after multiple network outages, Solana has retained strong network effects thanks to these advantages.
---
Project Categories
Solana’s ecosystem spans several verticals, creating a diversified application landscape:
- First‑layer smart‑contract platform: Competes directly with Ethereum, Avalanche, Aptos, and others.
- DeFi infrastructure: Powers decentralized exchanges like Jupiter, Drift, and MarginFi.
- NFTs and gaming: Hosts well‑known collections such as Mad Lads, alongside marketplaces like Tensor and Magic Eden.
- Payments and consumer apps: Solana Pay enables near‑zero‑fee, real‑time crypto payments.
- Social finance and AI projects: Emerging protocols blend social graphs with on‑chain intelligence to explore novel financial models.
This cross‑domain footprint makes Solana one of the few L1 ecosystems that attracts both institutional interest and grassroots retail adoption.
---
Token Economics – Functions of SOL
- Ticker: SOL
- Network: Solana Mainnet
- Maximum supply: No hard cap (inflationary model with annual decay)
- Circulating supply: Approximately 470 million SOL (October 2025)
- Inflation rate: Roughly 6.5 %, decreasing each year toward 1.5 %
- Market cap: ≈ $96 billion
Practical Uses
- Transaction fuel: SOL pays the gas fees for executing smart contracts or transferring assets.
- Staking and validation: Holders can delegate to validators and earn 6‑8 % annual staking rewards.
- Governance (in development): Through Solana Improvement Proposals (SIPs), on‑chain governance capabilities are being introduced gradually.
- Network security: Staked SOL secures consensus, creating an intrinsic demand for long‑term holders.
Initial Distribution
- 38 % allocated to community and staking rewards
- 25 % to the Solana Foundation
- 20 % to early investors
- 17 % to the team and advisors
Although inflation exists, the on‑chain fee‑burn mechanism partially offsets supply growth, helping SOL’s value remain relatively stable as demand rises.
---
Market Position and Competitive Edge
Technical Dimension
Solana’s monolithic architecture and high TPS deliver execution speeds and latency comparable to centralized exchanges—an achievement that is difficult to replicate on Ethereum or existing Layer‑2 solutions.
Developer Ecosystem
The number of active developers consistently ranks among the global top three, with the adoption of the Rust programming language attracting many traditional software engineers.
Cost Advantage
Transaction fees stay well below $0.01, giving Solana a clear cost advantage for high‑frequency DeFi and NFT trading.
Institutional and Capital Support
Leading venture firms such as Multicoin Capital, Jump, and a16z continue to back Solana infrastructure; consumer brands like Shopify and Visa have begun pilot projects with Solana Pay.
Resilience and Recovery
While the network experienced outages in 2022‑2023, the introduction of a local fee market and diversified validator clients since 2024 has markedly improved stability.
Taken together, these factors position Solana to potentially lead the high‑performance blockchain infrastructure space for the long term.
---
Primary Risks
- Centralization risk: Validator stake remains concentrated among a handful of large entities.
- Network reliability: Past outages have been mitigated but could still affect market confidence.
- Competitive landscape: Ethereum Layer‑2s (Arbitrum, Base, Optimism) and emerging L1s (Sui, Aptos) offer comparable scaling solutions.
- Regulatory uncertainty: Token classification and staking‑reward regulations may impact institutional participation.
- Token unlocks: Scheduled releases for the foundation or early investors could exert short‑term downward pressure on price.
As validator decentralization improves and the network matures, these risks are expected to diminish over time.
---
Key Adoption and Ecosystem Metrics
- Total Value Locked (TVL): Approximately $16.4 billion, a substantial rise from under $1 billion two years ago.
- Daily active addresses: Over 1.8 million.
- Monthly on‑chain transactions: Exceed 200 million.
- DeFi trading volume: Platforms like Jupiter and Drift lead the chain’s DEX activity.
- NFT trading volume: Ranked second only to Ethereum by transaction count.
- Mobile penetration: The Saga phone and apps supporting Solana Pay continue to expand their user bases.
These figures indicate that Solana’s on‑chain usage is shifting from pure speculation to genuine business demand.
---
Solana Price Forecast and Scenario Assumptions
Current reference price: about $204
All‑time high: $259.96 (November 2021)
Defined Scenarios
Forecast Table (for illustration only)
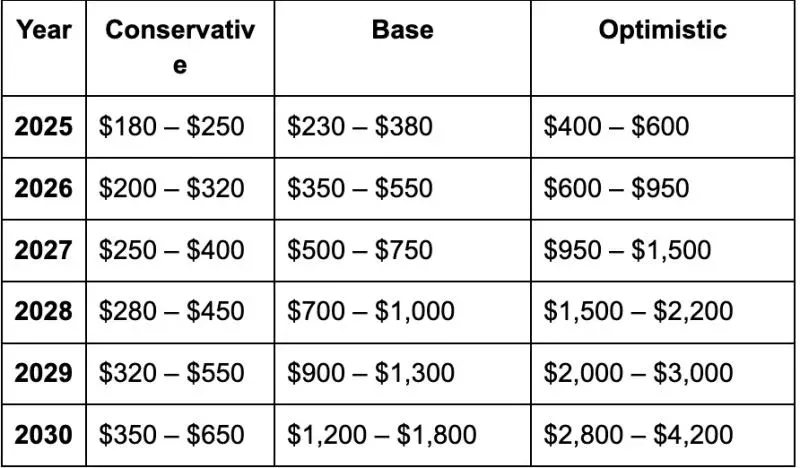
Key Drivers
- Conservative: Valuation climbs modestly as global crypto adoption slows.
- Base case: Continuous expansion of DeFi, gaming, and payment use‑cases, plus institutional usage of Solana Pay, pushes price above the historic high.
- Bullish: If Solana secures a leading role in mainstream finance and Web3, network activity could grow tenfold, potentially lifting market cap beyond $100 billion and driving price into four‑digit figures.
During bullish cycles, rising staking demand combined with a capped supply could further amplify upside potential.
---
Long‑Term Price Outlook: 2026‑2037
2026 Forecast
If the high target is achieved, 2026 could see an overall ‑4.53 % correction from today’s level.
2027‑2032 Forecast
Should the upper bounds be realized, the price could increase by 272.52 % relative to today’s level by 2032.
2032‑2037 Forecast
| Year |
💡 Register on Binance with referral code B2345 for the maximum trading fee discount. See Binance complete guide.
⚠️ Risk Disclaimer: Crypto prices are highly volatile. This is not investment advice.


