
 Bitaigen Research
Bitcoin’s first full calendar year after the 2025 halving closed in negative territory, with the price oscillating in a band near $88,000 and potentially testing the critical $93,500 level again toward the end of the year.
According to Bitcoin analysts, although the market could once more approach $93,500 before year‑end, the appearance of a red candle in 2025 would undermine the four‑year cycle hypothesis.
The weekend highs for Bitcoin continued to climb, making the weekly candlestick pattern the focal point of market discussion.
In this article we systematically review the overall performance of the first post‑halving year, dissect key technical formations and capital flows, and examine the possible turning point at the close of the year. By leveraging multidimensional data and expert commentary, we aim to help readers grasp the market rhythm and spot potential opportunities in the next phase.
Key Takeaways
- Bitcoin experienced an unusually calm weekend, and analysts are closely watching a potential three‑day bullish divergence that could be forming.
- It is expected that significant capital reallocation will not occur until after the New Year, at which point price dynamics may shift noticeably.
- So far this year Bitcoin has slipped roughly 6 percent, positioning it to set a record as the first post‑halving year to end in negative territory.
A New Year Could Push Bitcoin Toward $100,000
Data from TradingView show that after two consecutive days of almost no movement, Bitcoin’s price is now edging toward the $88,000 mark.
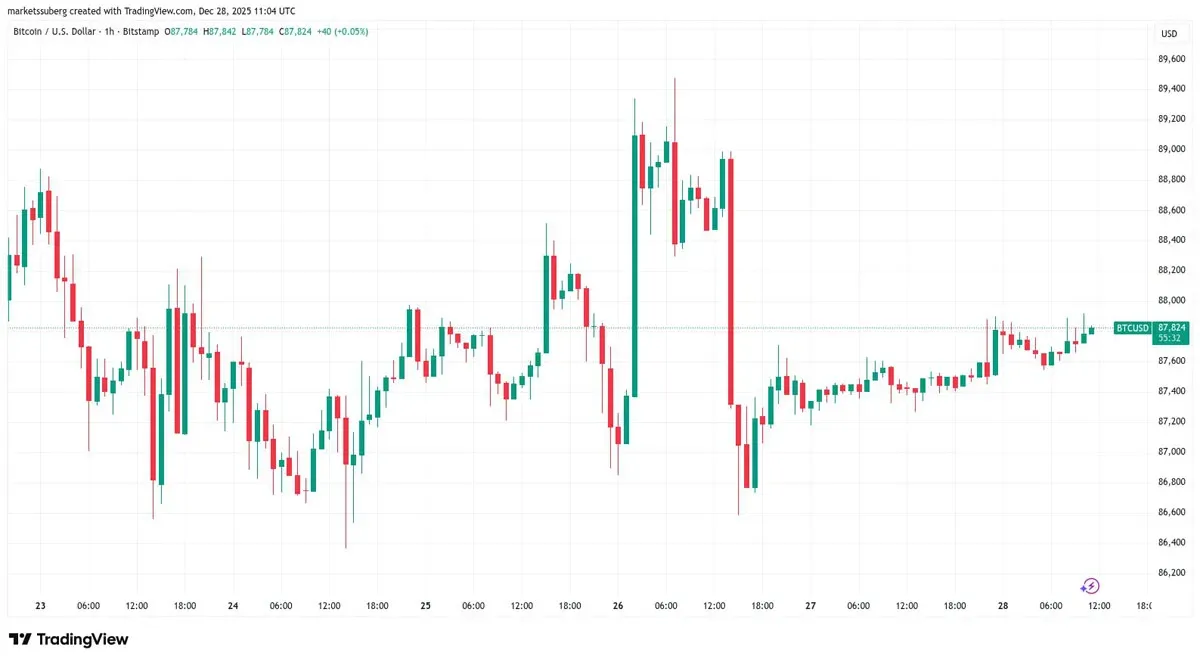
BTC/USD – 1‑hour chart. Source: Cointelegraph/TradingView
Friday saw a familiar “false breakout” pattern, with liquidity chasing a record‑setting $24 billion options expiry event. As reported by Cointelegraph, that phenomenon exerted a modest suppressive effect on price.
The current bullish case is largely anchored in a three‑day Relative Strength Index (RSI) divergence that has emerged on the short‑term chart.
“Bitcoin locked in a three‑day bullish divergence, right on top of key support,” trader Jelle wrote in an X post.
“The previous two bottoms formed with 3‑day divergences as well. Time for history to repeat?”
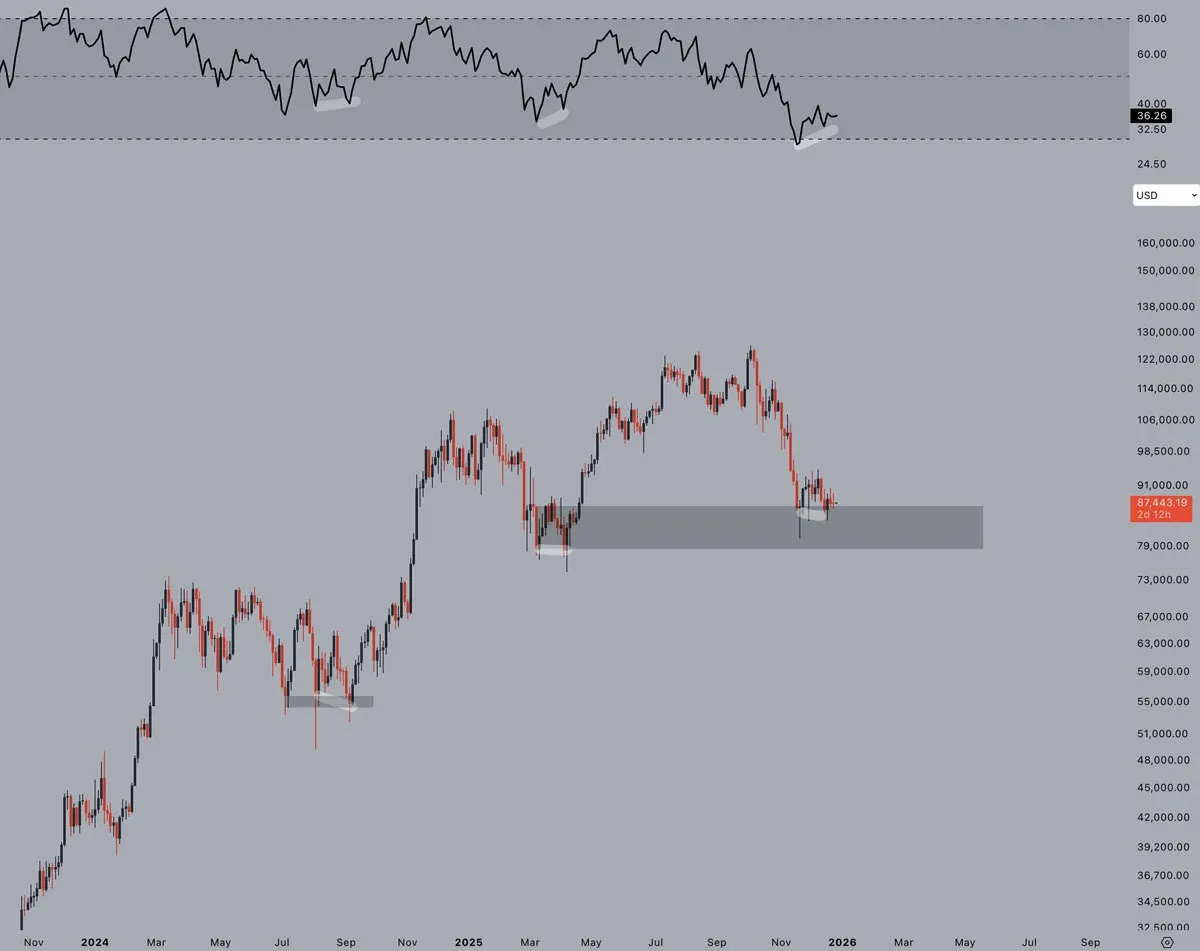
BTC/USD – 3‑day chart with RSI data. Source: Jelle/X
Trader BitBull believes the rebound is closely tied to seasonal factors. He notes that institutional investors typically re‑allocate funds to “underperforming assets” at the start of January.
“That could trigger a breakout of the trendline and move us toward $100,000,” he wrote in his Friday forecast.
$BTC may also experience a sideways consolidation lasting five to six days.
As 2025 draws to a close, the following events merit attention:
- Investors who sold Bitcoin at a loss for tax‑loss harvesting may repurchase the asset toward year‑end.
- New capital inflows into underperforming assets are expected again in January 2026.
These dynamics could spark a fresh wave of market volatility.
— BitBull (@AkaBull_) December 26, 2025
Trader‑analyst Aksel Kibar was not surprised by Bitcoin’s move into a range and the accompanying drop in volatility after a strong Q3 rally.
“Volatility is cyclical,” he posted to his followers on X.
“High volatility is followed by low volatility until we spot a clear chart pattern that allows us to capture an opportunity.”
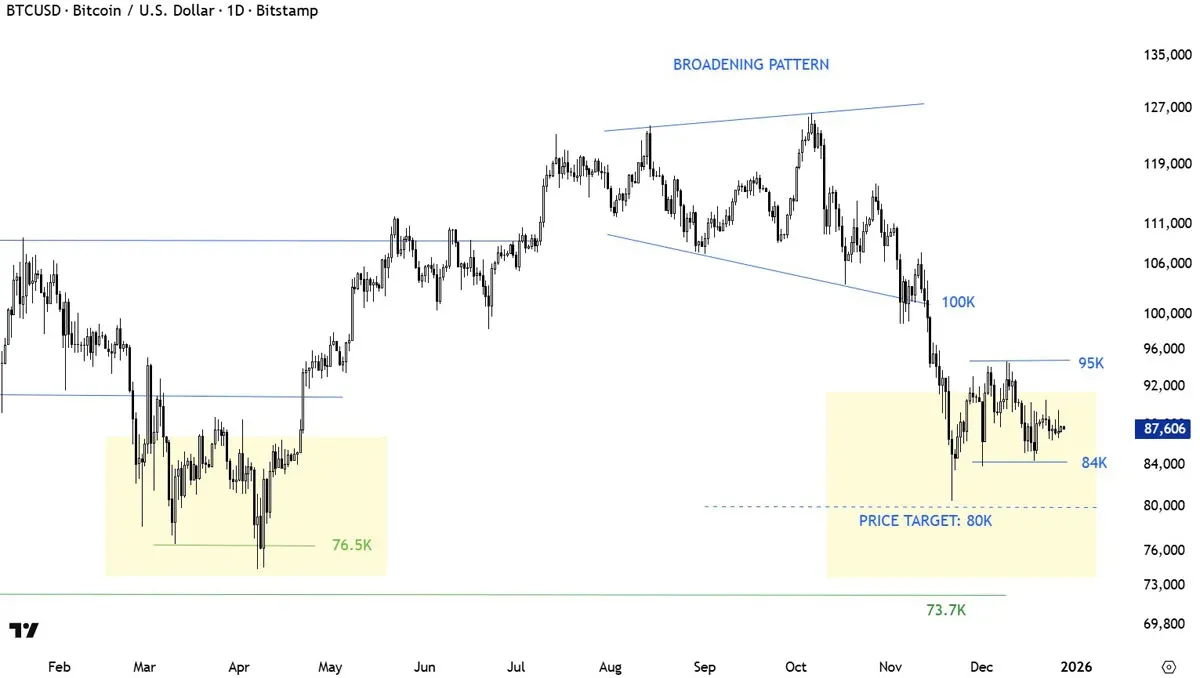
BTC/USD – Daily chart. Source: Aksel Kibar/X
Bitcoin’s Annual Candle Challenges the Four‑Year Cycle
With only a few days left before the 2025 annual candle closes, Bitcoin still faces the risk of setting a new bearish record for the year.
To date the asset has fallen about 6.1 percent, and BTC/USD is on track to become the first post‑halving year in history to finish down.
This development has prompted some observers to question whether the four‑year price cycle still holds relevance.
“Bitcoin has only four days left to close the year with a green candle.”
If the final daily candle ends negative, it will mark the first time in 14 years that a bull‑market year finishes in the red, suggesting a structural shift and a break from the traditional four‑year cycle narrative.
— Ajay Kashyap (@EverythingAjay) December 27, 2025
Material‑Indicators co‑founder Keith Allen emphasized that the color of the annual candle carries significant meaning.
“Breaking key price levels is expected—what truly matters is the closing price,” he wrote on Christmas Day, attaching a chart from Material Indicators’ proprietary trading toolkit.
“When the market opens in January, I will focus on macro insights derived from trend forecasts, especially the candle color at the close of Q4 and the full year.”
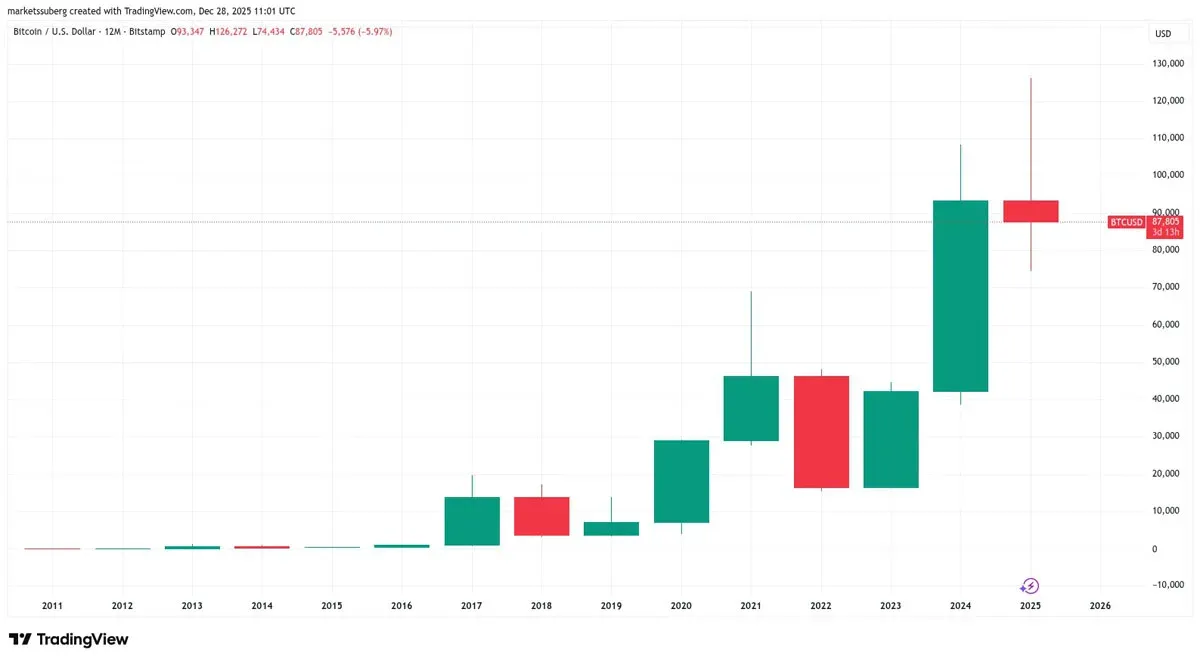
BTC/USD – 12‑month chart. Source: Cointelegraph/TradingView
Allen pointed out that the $93,500 zone near the annual trend line could still be tested at the very last moment.
The above constitutes a comprehensive analysis of Bitcoin (BTC) entering its first post‑halving year with a down‑year result and price lingering around $88,000. For further reading on the dynamics of a bearish first post‑halving year, please follow additional articles from Bitaigen (比特根).
*Note: Cryptocurrency transactions and gains may be subject to taxation in the user’s jurisdiction. Participants should consult local tax regulations and consider using SEPA or SWIFT for fiat transfers where applicable. U.S. residents wishing to trade on Binance should use Binance.US rather than the global platform.*
Related Reading
- Bitcoin 2026 Price Forecast: $90K Now, Potential Up to $250K
- Bitcoin Manipulation Allegations & Spot ETF Inflow Surge
- Bitcoin Halving Explained: Impact on Supply and Markets
💡 Register on Binance with referral code B2345 for the maximum trading fee discount. See Binance complete guide.



