
 Bitaigen Research
 On February 10, BTC’s latest price was $69,863, representing a 1.25 % decline over the previous 24 hours. At the same time, the funding rate in the derivatives market stayed in negative territory, and open‑interest volumes contracted, suggesting that bullish enthusiasm has not fully recovered. *(U.S. residents should use Binance.US rather than the global Binance platform.)*

In this article we dissect the technical and capital‑flow dynamics behind Bitcoin’s key thresholds, combining sentiment indices, on‑chain whale activity, and the latest derivatives data to objectively evaluate whether the current move signals a bull‑market revival or a bull‑trap. By layering the analysis, readers can clarify risks and opportunities. Continue reading for a panoramic view.
Support Signals for a Bull‑Market Restart
From the sentiment index, the current fear level has fallen to 9, placing it in the “extreme fear” zone. Historical experience shows that such extreme sentiment often coincides with market bottoms. On‑chain data further reveal that long‑term holders—so‑called “whales”—have recently added to their positions, with tracked addresses purchasing roughly $12.4 million worth of Bitcoin. In addition, corporate holder MicroStrategy continues to emphasize its accumulation plan, providing an extra confidence boost for the market.
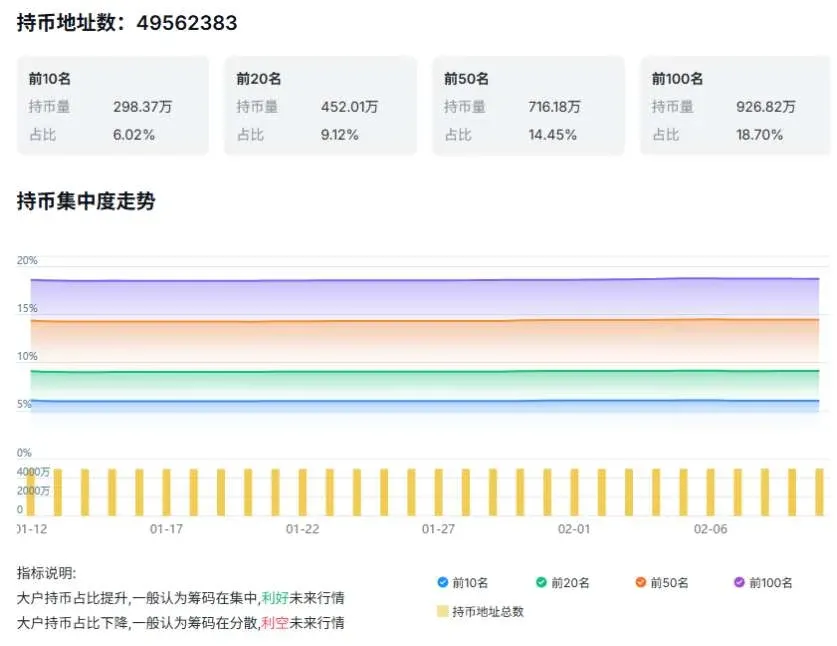
The Significance of the $70,000 Support Level
After the rapid drop to $60,033 on February 6, the $70,000 mark shifted from a prior support zone to the current critical resistance. If Bitcoin can hold this price with significant trading volume, short‑term upside toward the $72,000‑$74,000 range becomes plausible; a breach of the $68,000 support could push the price down toward $65,000. Although short‑covering has offered recent lift, the negative funding rate reminds us that market sentiment remains cautious and a clear unilateral bullish outlook has not yet formed.
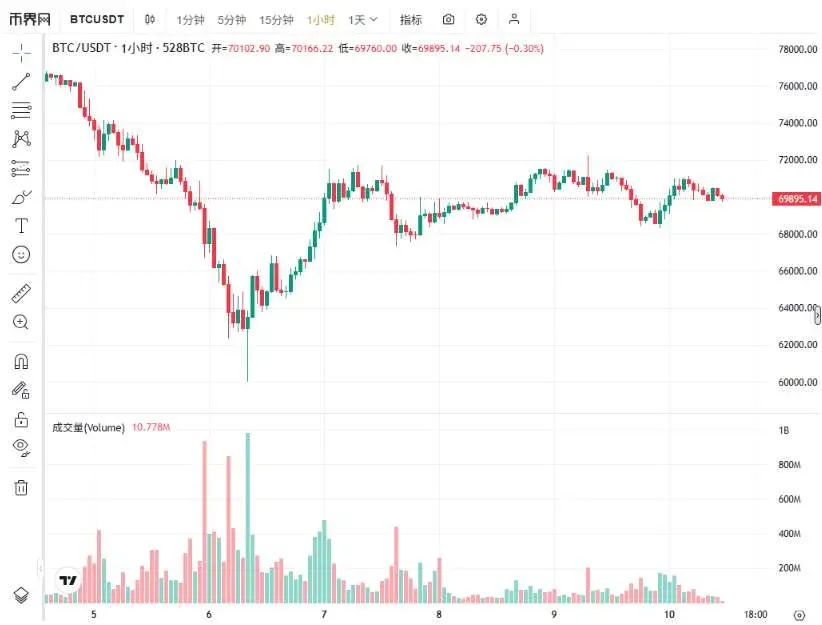
Historical Comparisons of Post‑Crash Bitcoin Rallies
Bitcoin has repeatedly staged strong rebounds after deep corrections. Notable examples include the 2022 slide from roughly $69,000 to $15,000, followed by a climb to the $126,000 all‑time high in 2025; and the 2018 drop from $20,000 to just above $3,000, after which the price surged back above $69,000 in 2021.
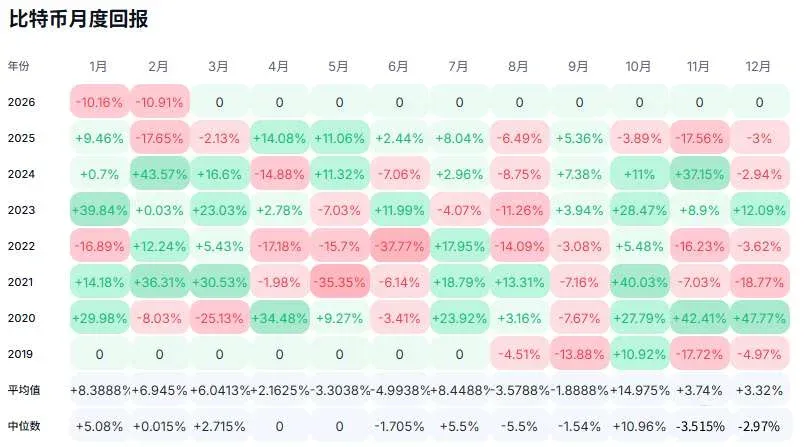
Statistically, the October 2025 peak has already retraced more than 44 %. Historical data indicate an average post‑decline return of about 50 %, leaving a hint that a bull market could be warming up. The current decisive factor is whether Bitcoin can stabilize above the $70,000 threshold long enough for a clearer trend signal to emerge.
Risk Warning: Potential Bull‑Trap
Even though the price has returned to $70,000, several warning signs cast doubt on the sustainability of the rally. Negative funding rates point to weakening leveraged demand; on the macro side, the Federal Reserve’s hawkish expectations and statements from the U.S. Treasury Secretary that there is “no bailout authority” for crypto assets continue to dampen sentiment.
Equally noteworthy is the weakening correlation between Bitcoin and traditional assets. In January 2026, Bitcoin fell 11 %, while gold rose 13 % and the S&P 500 climbed 1.4 %, suggesting that Bitcoin is no longer a typical “safe‑haven” instrument.
Institutional capital flows also show an outflow trend. Last week, U.S. spot Bitcoin ETFs recorded a net outflow of $1.7 billion, a stark contrast to the net inflows seen in 2025. If Bitcoin cannot hold near $70,000 and attract fresh capital, the current up‑trend may well be a carefully orchestrated bull‑trap.
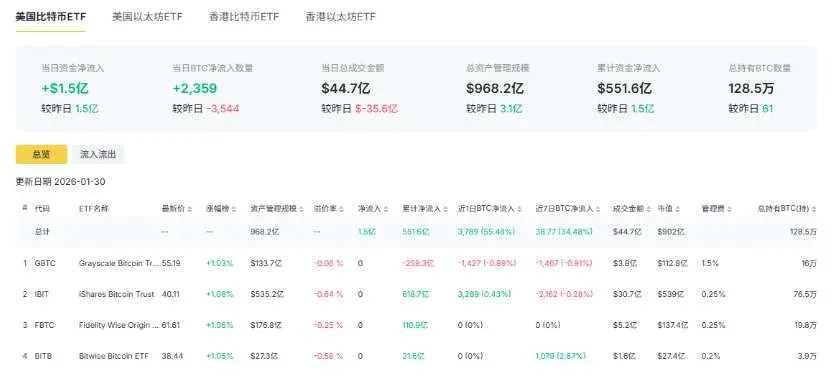
Overview of Bitcoin ETFs on February 9
*(Insert the corresponding ETF data overview here, preserving the original structure.)*
Closing Thoughts
After reclaiming the $70,000 level, Bitcoin will continue to face dual tests from policy developments and liquidity constraints in the short term. Investors should monitor defensive position changes in the derivatives market, macro‑level liquidity pressures, and whether ETF fund flows show sustained improvement. Historical experience reminds us that extreme fear often coincides with market bottoms, yet the strength and durability of any bounce should be approached with caution.
This concludes the brief analysis of “Bitcoin’s recent return to $70,000 – a bull‑market restart signal or a bull‑trap?” For more insights, you can search for previous Bitaigen (比特根) articles or continue reading the related links below. Thank you for your attention and support!
*(Please note that cryptocurrency gains may be taxable in your local jurisdiction.)*
Related Reading
- Key Factors Influencing Bitcoin Price: Supply, Macro Trends & Tech
- Bitcoin Drops Below $86K as Market Extends Bearish Run
- Bitcoin Breaks Key Support: Is Its “Digital Gold” Status at Risk?
💡 Register on Binance with referral code B2345 for the maximum trading fee discount. See Binance complete guide.



