
 Bitaigen Research
 In this article we review the latest Bitcoin technical chart released by PlanB, focusing on the momentum signals behind indicators such as RSI and MVRV. By comparing historical ranges with the current trend, we reveal the logic suggesting that Bitcoin still has upside potential and highlight details worth watching. If you want to understand why these indicators are considered bullish, keep reading.
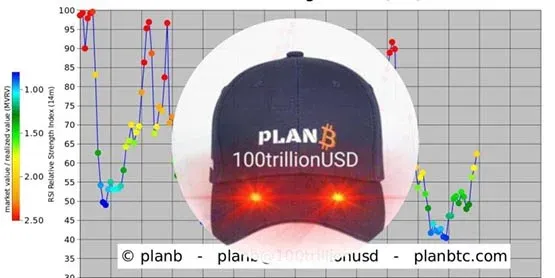
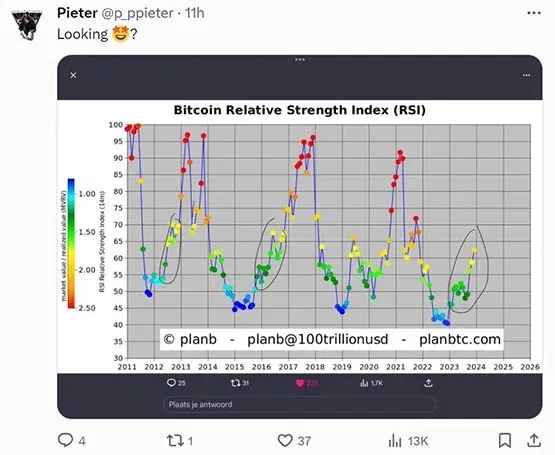
PlanB’s newest chart displays RSI, MVRV and other key technical metrics, pointing out that Bitcoin’s momentum is still rising and implying that there remains upward room ahead, with an overall bullish tilt.
Today, PlanB posted another Bitcoin analysis graphic on X (formerly Twitter) with the caption “Wow!”. Although no textual explanation was provided, the chart’s RSI line, the colour‑coded MVRV ratios, and the “#AsymmetricBets” tag all convey his bias toward a long‑side outlook on Bitcoin.
RSI sitting in the 60‑65 band: not yet in extreme overbought territory
RSI (Relative Strength Index) measures price momentum and is commonly interpreted as overbought above 70 and oversold below 30. The thresholds for the Bitcoin market may differ slightly, but the relative levels remain a useful reference.
- Bitcoin’s current RSI is roughly between 60‑65, well below the peaks seen in past bull markets (around 90)
- This indicates that momentum is still climbing, but it has not reached an extreme overbought state
MVRV around 2: market price is about twice the average purchase price
The coloured dots on the chart represent changes in MVRV (Market‑Value‑to‑Realized‑Value). MVRV is calculated as follows:
| Calculation Item | Explanation |
|---|---|
| **Circulating Market Cap** | Current price × total circulating supply |
| **Realized Market Cap** | Average price at which each Bitcoin last changed hands × total circulating supply |
| **MVRV** | Circulating Market Cap ÷ Realized Market Cap |
The realized market cap approximates the average cost basis of holders. PlanB’s illustration shows MVRV close to 2, meaning the current market price is roughly double the average purchase price.
What the “AsymmetricBets” tag means
AsymmetricBets refer to investment opportunities where the potential upside far exceeds the possible loss. The core points are:
- Small risk exposure paired with a large potential reward
- Requires tight risk management and contrarian thinking
- Not suitable for investors who are prone to emotional volatility
Overall assessment: PlanB maintains a bullish stance on Bitcoin
- High RSI + high MVRV may signal an overheated market, warranting caution about a possible correction
- Low RSI + low MVRV could indicate a buying opportunity
In the current chart, RSI remains in an upward range while MVRV stays near 2. Coupled with the “#AsymmetricBets” label, PlanB suggests that Bitcoin’s upside potential outweighs its downside risk.
Community member Pieter, after comparing the historical trajectories, believes that both RSI and MVRV still have room to move higher, further confirming PlanB’s bullish expectation.
It is important to note that these technical indicators do not move in lockstep with price. For example, when Bitcoin hit its all‑time high at the end of 2021, neither RSI nor MVRV peaked simultaneously. Therefore, investors should employ a suite of tools and fundamental analysis rather than relying on a single chart for all decisions.
That summarizes the key points behind PlanB’s bullish implication for Bitcoin. For more articles on topics such as the 60‑65 RSI range and MVRV analysis, please follow Bitaigen (比特根) and its other publications.
Related Reading
- Bitcoin MVRV Ratio Signals Cyclical Bottom Below $110,000
- Bitcoin On-chain Analysis: MVRV Ratio and NUPL Guide
- Bitcoin Identity Crisis: Dropping Safe‑Haven Appeal
💡 Register on Binance with referral code B2345 for the maximum trading fee discount. See Binance complete guide.



