
Bitcoin's supply structure exhibits clear stratification, with various wallet sizes collectively shaping today's on-chain landscape.

This article examines Bitcoin's journey from genesis block to new price highs, analyzing its supply structure, market behavior, and on-chain evolution to help readers identify key milestones and potential opportunities in digital asset long cycles, inviting continued exploration.

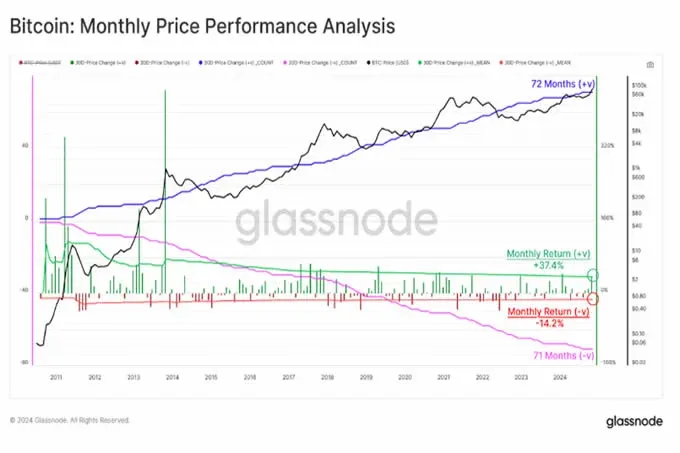
Market Expansion
Bitcoin's trading price has been active for 5,256 days, rising from a few cents to $100,000. This includes 72 positive monthly candlesticks (including December 2024), averaging a 37.4% increase, and 71 negative monthly candlesticks, averaging a -14.2% decline. This distribution of positive and negative monthly lines indicates a subtle balance between bull and bear markets, with a positive bias during major upward phases.
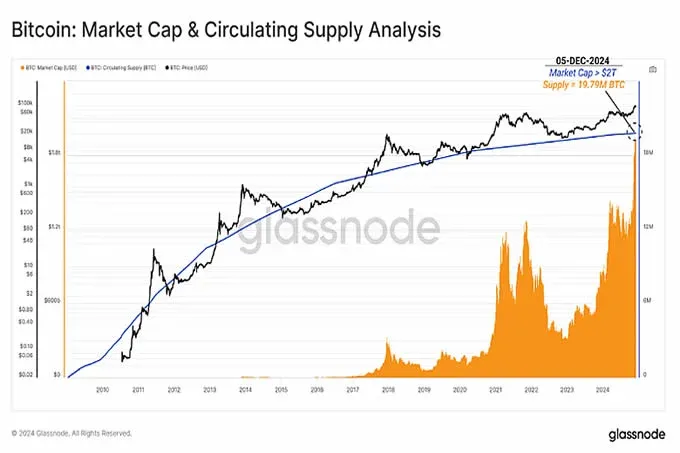
As of December 5, the total mined Bitcoin reached 19,791,952 BTC, representing 94.2% of the 21,000,000 BTC total supply. Bitcoin's market cap briefly surpassed $2 trillion, exceeding silver's approximate $1.84 trillion market cap.
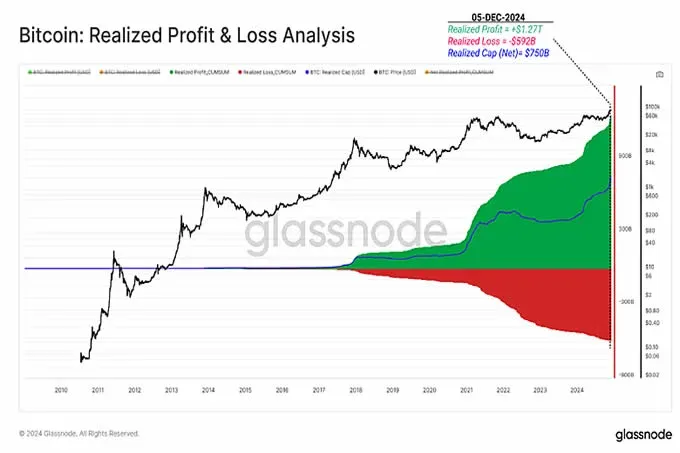
During this market expansion period, investors realized $1.27 trillion in profits while experiencing $592 billion in on-chain losses (calculated via bid-ask spread). The resulting net capital inflow (i.e., actual market cap) reached $750 billion, highlighting the immense value absorbed by the Bitcoin network over its lifetime.
Supply Distribution
Mined Bitcoin is distributed by wallet size as follows:
- <0.001 BTC: 5,491 BTC (0.027%)
- 0.001–0.01 BTC: 42,683 BTC (0.216%)
- 0.01–0.1 BTC: 271,641 BTC (1.373%)
- 0.1–1 BTC: 1,077,839 BTC (5.446%)
- 1–10 BTC: 2,093,845 BTC (10.581%)
- 10–100 BTC: 4,306,780 BTC (21.761%)
- 100–1,000 BTC: 4,342,868 BTC (21.935%)
- 1,000–10,000 BTC: 4,693,216 BTC (23.716%)
- 10,000–100,000 BTC: 2,309,654 BTC (11.671%)
- >100,000 BTC: 647,934 BTC (3.274%)
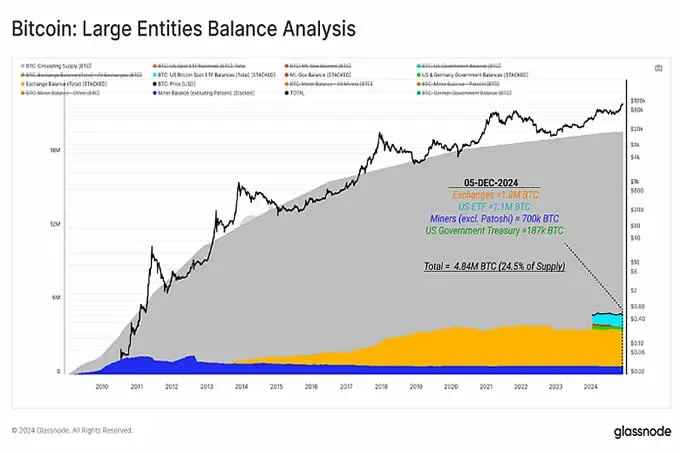
Most whale addresses holding 1,000+ BTC are typically associated with exchanges, ETFs, or large institutions (e.g., MicroStrategy), which actually represent the collective holdings of thousands or millions of users and shareholders.
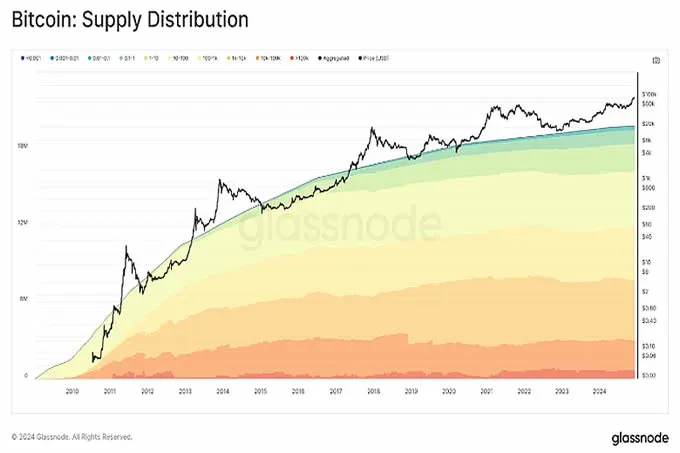
Notably, exchanges hold approximately 1.8 million BTC (9.1% of supply), U.S. ETFs manage about 1.1 million BTC (5.6% of supply); miners (excluding Patoshi) retain roughly 700,000 BTC (3.5% of supply), while the U.S. Treasury holds around 187,000 BTC (0.9% of supply). This distribution highlights Bitcoin's broad dispersion across entities and reflects the growing institutionalization and centralization of custodial services. (Note: The earliest independent miner is regarded by the community as Satoshi Nakamoto, with their mining pattern referred to as Patoshi)
Network Evolution
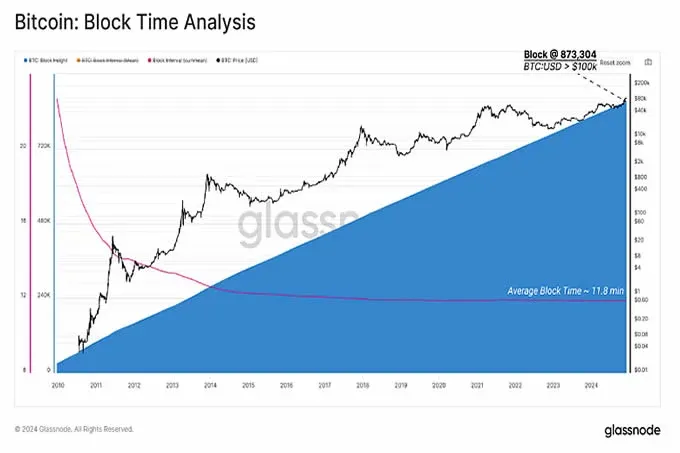
Since the genesis block, the network has generated 873,304 blocks, with an average block time of 11.8 minutes. Although the current average block interval is approximately 9.6 minutes, early performance was slower due to Satoshi Nakamoto's overestimation of laptop CPU performance.
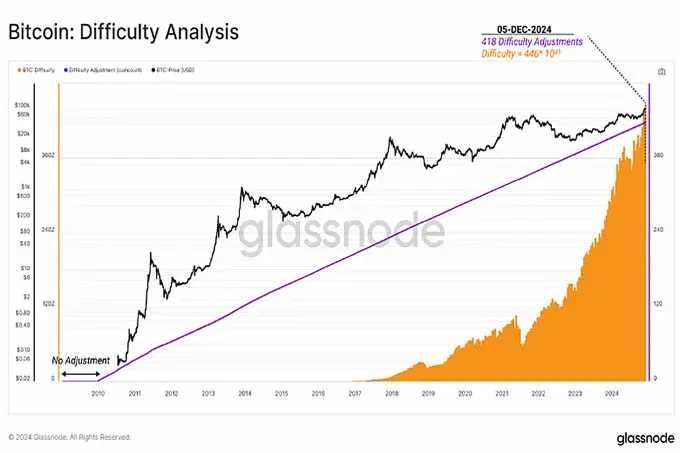
Meanwhile, network difficulty has undergone 418 adjustments (excluding non-adjustment periods), reaching 446,331,432,498,125,300,000,000. Bitcoin's proof-of-work (PoW) mechanism difficulty adjustment aims to maintain approximately one block every 10 minutes; adjustments occur every 2,016 blocks (about two weeks) to keep the target block time at 600 seconds.
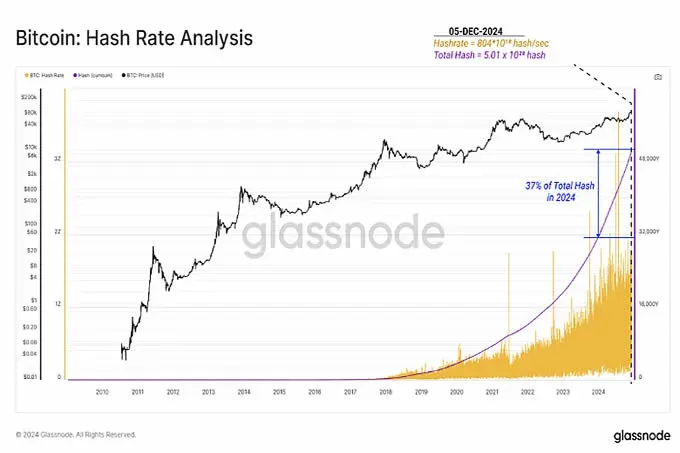
When Bitcoin price reached $100,000, network hash rate surged from 128,185 H/s to 804,407,834,059,443,100,000 H/s. To date, miners have performed approximately 5.01×10^28 hashes, with 2024 contributing 37% of the total.
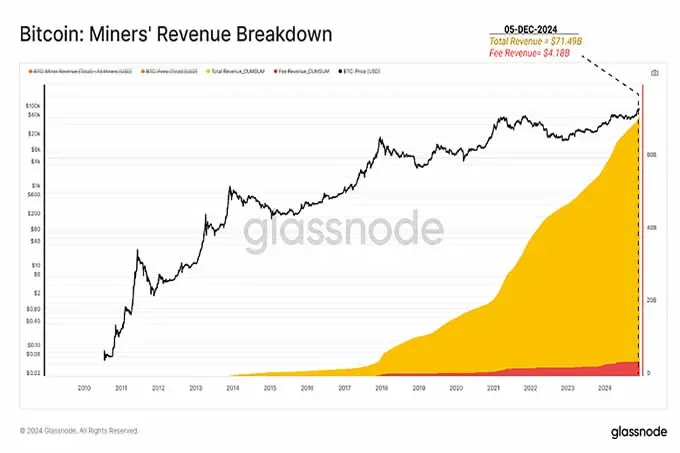
As of December 5, miners' cumulative revenue stands at $71.49 billion, comprising $67.31 billion in block rewards (calculated from daily block reward prices) and $4.18 billion in user-paid transaction fees. This revenue represents only 3.57% of Bitcoin's $2 trillion peak market cap, indicating an extremely high return on security budget investment.
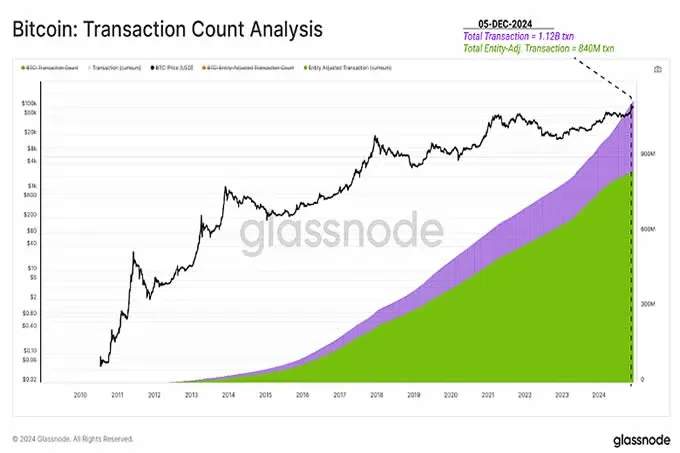
The Bitcoin network has processed 1.12 billion transactions (unfiltered); after excluding internal transfers, the actual economic transaction count is 840 million.
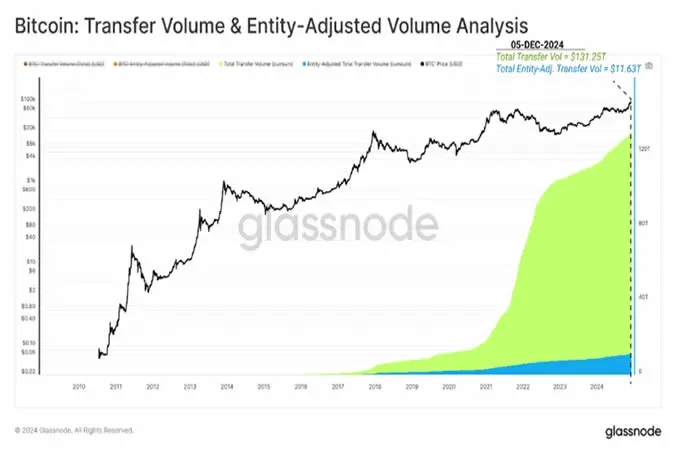
Using USD value at confirmation, the network's cumulative transfer volume reaches $131.25 trillion; filtered real economic transfer volume is $11.63 trillion, accounting for only 8.86% of the total. This indicates that while most on-chain transaction volume stems from internal scheduling by large exchanges and custodial wallets, genuine economic activity still accounts for a notable share.
Conclusion
Bitcoin's price surpassing $100,000 is not merely a numeric milestone; it symbolizes its evolution from an internet periphery project to a globally significant financial infrastructure. Since the genesis block, the Bitcoin network has continuously expanded, with market cap briefly exceeding $2 trillion—surpassing silver—and settling $131 trillion in transfer volume across 1.12 billion transactions.
The network has paid miners $71.49 billion, representing just over 3% of its market valuation, to cover its own security costs—reflecting an astonishing return on computational investment. Hash rate approaches historical highs, holder distribution remains highly decentralized, and Bitcoin's role on the world stage grows increasingly important.
Here concludes the overview of Bitcoin's network and economic foundation evolution from genesis block to breaching $100,000. For further insights on Bitcoin's evolution, search Bitaigen's (Bitgen) prior articles or continue browsing related materials below. Thank you for your ongoing support of Bitaigen (Bitgen)!
Related Reading
- Bitcoin Development Timeline: From Concept to Global Asset
- 比特币价格全历程解析(2009‑2026)走势、关键节点与未来预测
- Bitcoin Price Trajectory: 15‑Year Analysis & Future Trends
💡 Register on Binance with referral code B2345 for the maximum trading fee discount. See Binance complete guide.


