
In this article we systematically cover the classification of Doji patterns, interpret their signals, and discuss practical positioning. We explore the many variants of the Doji and their meanings in different trends, helping readers capture key turning points and combine common indicators to improve judgment accuracy. If you want to learn how to accurately spot this neutral signal amid market noise, keep reading.
Introduction
In technical analysis, candlestick charts are the core tool for observing price fluctuations, and the Doji is frequently watched by traders because of its simple shape and direct information. A Doji does not directly predict a rise or fall; its significance usually depends on the surrounding trend and its interaction with other technical indicators. This article systematically reviews the various Doji shapes, their combinations, and how they can be applied in real‑world trading, enabling readers to interpret this neutral signal more accurately.
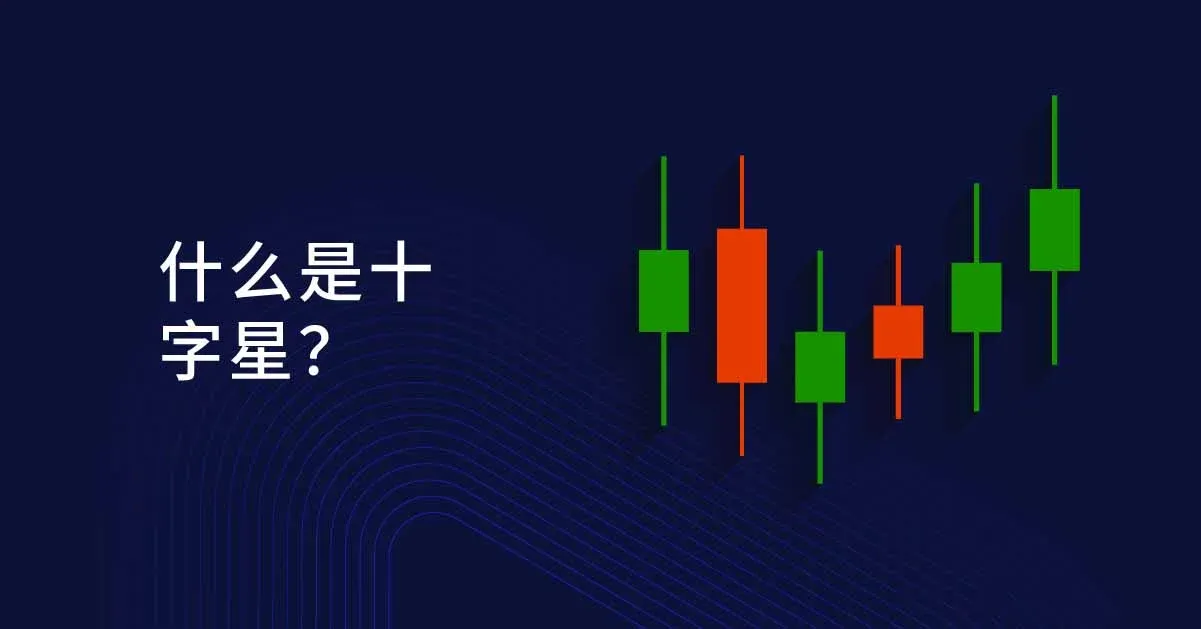
What Is a Doji Candlestick?
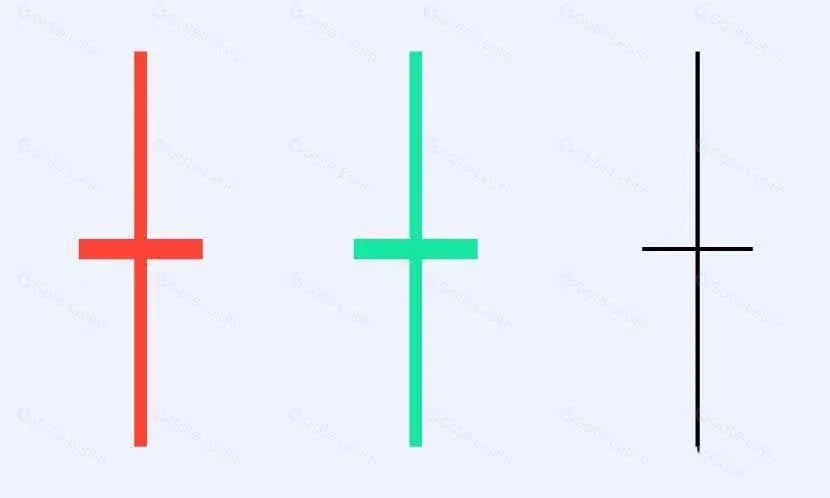
A Doji looks like a “+” sign: the real body is extremely thin—practically invisible—while the upper and lower shadows are relatively long. If the upper and lower shadows are of roughly equal length, the Doji appears as a true cross; if one side is noticeably longer, it forms a “reverse” Doji. Fundamentally, the opening price is almost equal to the closing price, indicating that buying and selling forces were evenly matched during the period, causing the price to swing widely between its high and low before returning to the opening level.
Meaning of a Doji
- Open ≈ Close, showing that buyers and sellers were balanced in that interval.
- Long upper and lower shadows suggest high volatility and intense market sentiment that did not develop into a unilateral trend.
Doji as a Reversal Signal
Dojis are often viewed as a pre‑cursor to a possible trend reversal, but a single Doji alone cannot confirm direction; it must be evaluated together with subsequent candles and the overall price action. When a clear up‑trend or down‑trend has already been established, the appearance of a Doji often signals that the momentum of that trend is weakening.
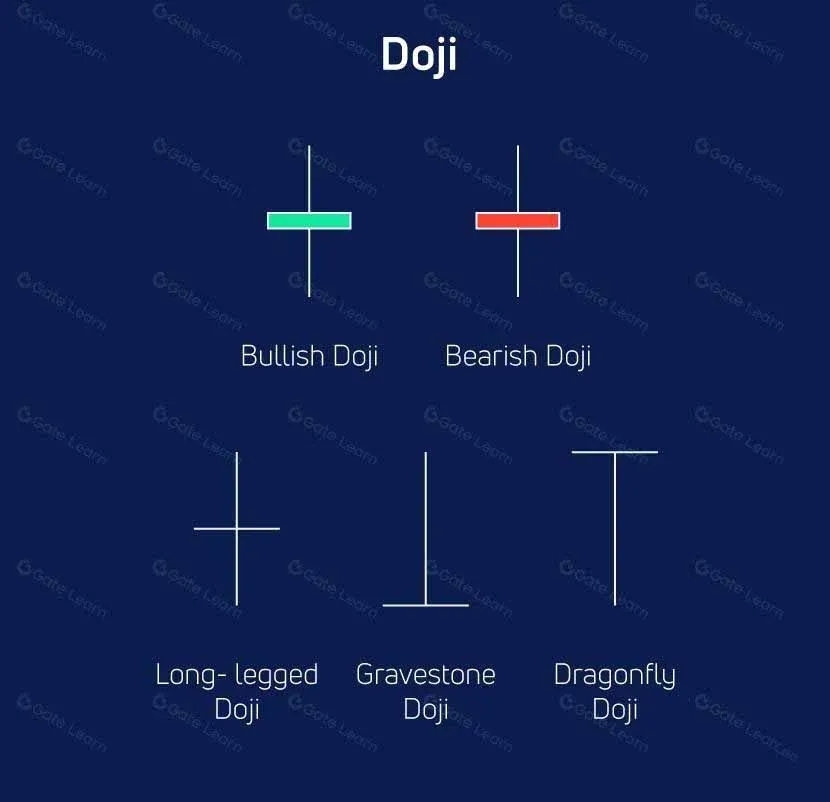
Five Doji Pattern Types
By MS.AMANDA
1. Small Doji

By MS.AMANDA
A Small Doji has very short upper and lower shadows, indicating almost no price movement during that period. It often appears near the upper or lower edge of a ranging market, representing continued sideways consolidation; if it shows up in a trending market, it usually reflects a brief pause rather than a decisive change in direction.
2. Large Doji
By MS.AMANDA
A Large Doji features long upper and lower shadows, signifying strong battling between buyers and sellers. In an up‑trend, a Large Doji often means bearish pressure is intensifying; in a down‑trend, it suggests that bullish support is gaining strength, and it is frequently interpreted as a potential turning point. When holding a position aligned with the prevailing trend, traders may consider waiting for confirmation before adjusting their exposure.
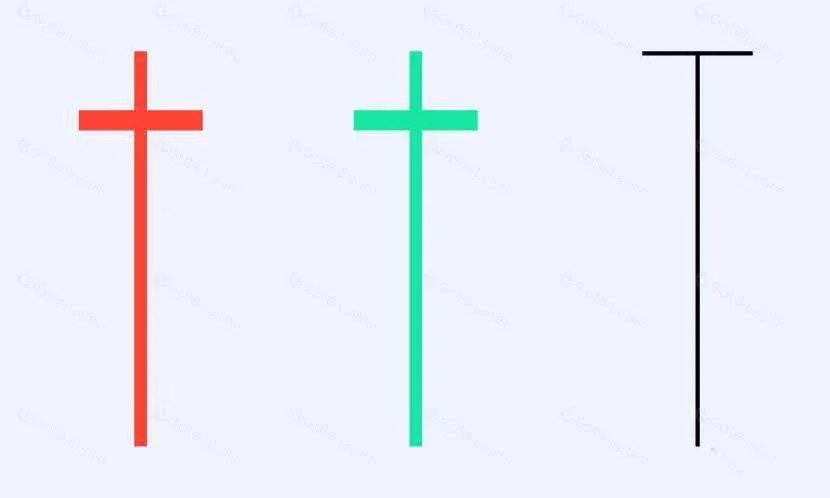
3. T‑Shaped Dragonfly Doji
By MS.AMANDA
In this formation the lower shadow is markedly longer than the upper shadow, and the open and close are almost identical. If it appears at a support level during a downtrend, it is often interpreted as the first sign of buying interest that could trigger a rebound. Conversely, if it shows up at a resistance level in an uptrend, it indicates that bulls failed to push higher, hinting at weakening upward momentum and a possible consolidation or pull‑back.
4. Inverted T‑Shaped Gravestone Doji
By MS.AMANDA
The opposite of the Dragonfly Doji, the Gravestone Doji has a much longer upper shadow than lower shadow. It typically appears near the top of an uptrend, revealing sudden selling pressure that may weaken the trend. When it occurs in a downtrend, its significance is relatively muted and is usually viewed as a short‑term amplification of bearish pressure.
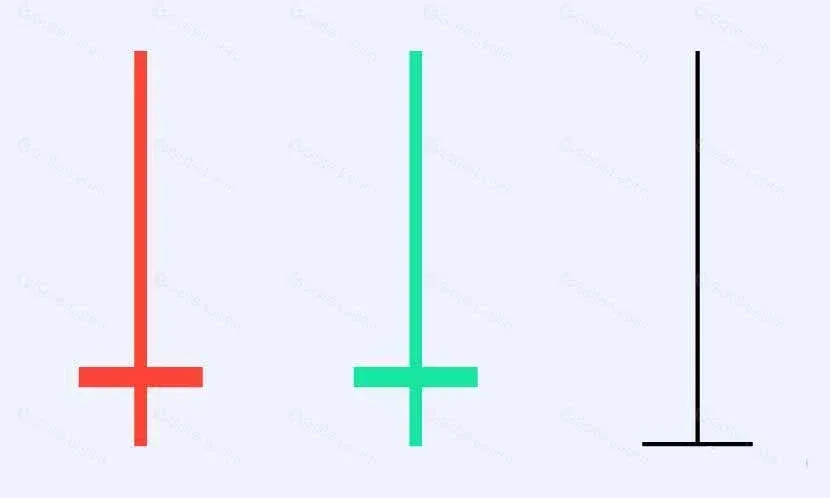
5. Long‑Legged Doji (One‑Line Doji)

By MS.AMANDA
A Long‑Legged Doji has virtually no real body and equal‑length shadows on both sides, representing an extreme neutral stance. Because it is rare, it is often seen as a sign of deep market indecision, and traders should look at higher‑timeframe trends to gauge the likely subsequent direction.
Three Doji Combination Structures
1. Morning Star
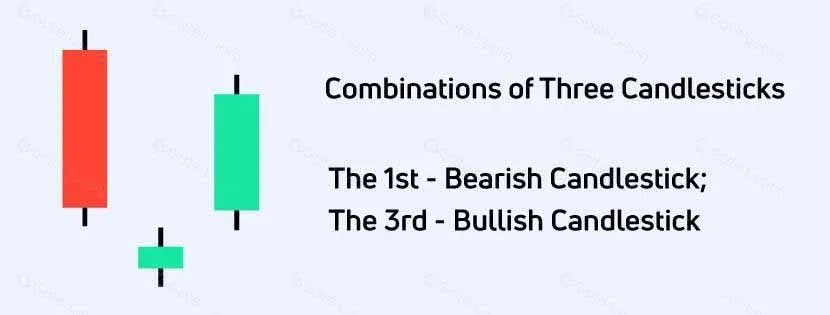
By MS.AMANDA
The pattern consists of three candles: a long bearish candle, a Doji (usually with reduced volume), and a long bullish candle. It commonly appears at the bottom of a downtrend, representing bullish divergence and signaling a possible clear reversal.
2. Evening Star
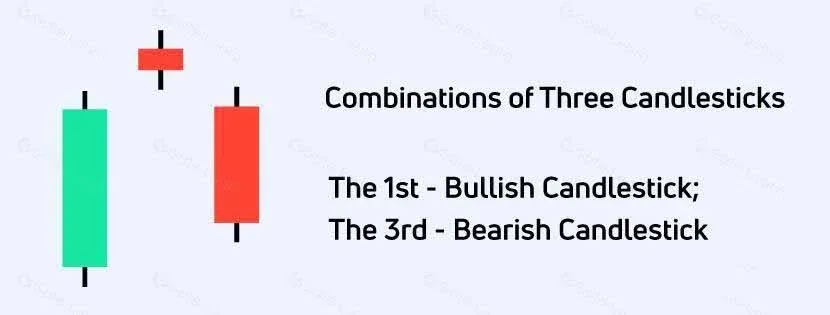
By MS.AMANDA
The structure is the mirror image of the Morning Star: a long bullish candle, followed by a Doji, and then a long bearish candle. It often occurs at the top of an uptrend, marking the transition from bullish to bearish control. If a gap exists between the three candles, the reliability of the signal increases, making it a useful reference point for short‑selling.
3. Continuation Doji
By MS.AMANDA
This formation often appears during a trend pull‑back or consolidation phase, indicating that the prevailing trend may still have room to continue. When it shows up in a rising market’s shake‑out or a falling market’s rebound zone, it is usually interpreted as a continuation signal.
Signals and Pitfalls Associated with Doji Appearances
Fundamentally, a Doji reflects a balance of buying and selling forces within a specific price range. When combined with preceding and following price action, it can provide useful clues about future moves.
Misleading Doji After a Strong Trend
When a bullish or bearish wave is already well‑established, a Doji may simply represent profit‑taking or short covering rather than a genuine reversal. If the trend remains strong afterward, the Doji can be a false signal, potentially leading to an erroneous trade decision.
Doji During a Sideways Market
In a range‑bound environment where the direction is unclear, a Doji may foreshadow an imminent, sizable unilateral move. If the subsequent price action does not confirm the breakout, investors can easily misjudge the intended direction.
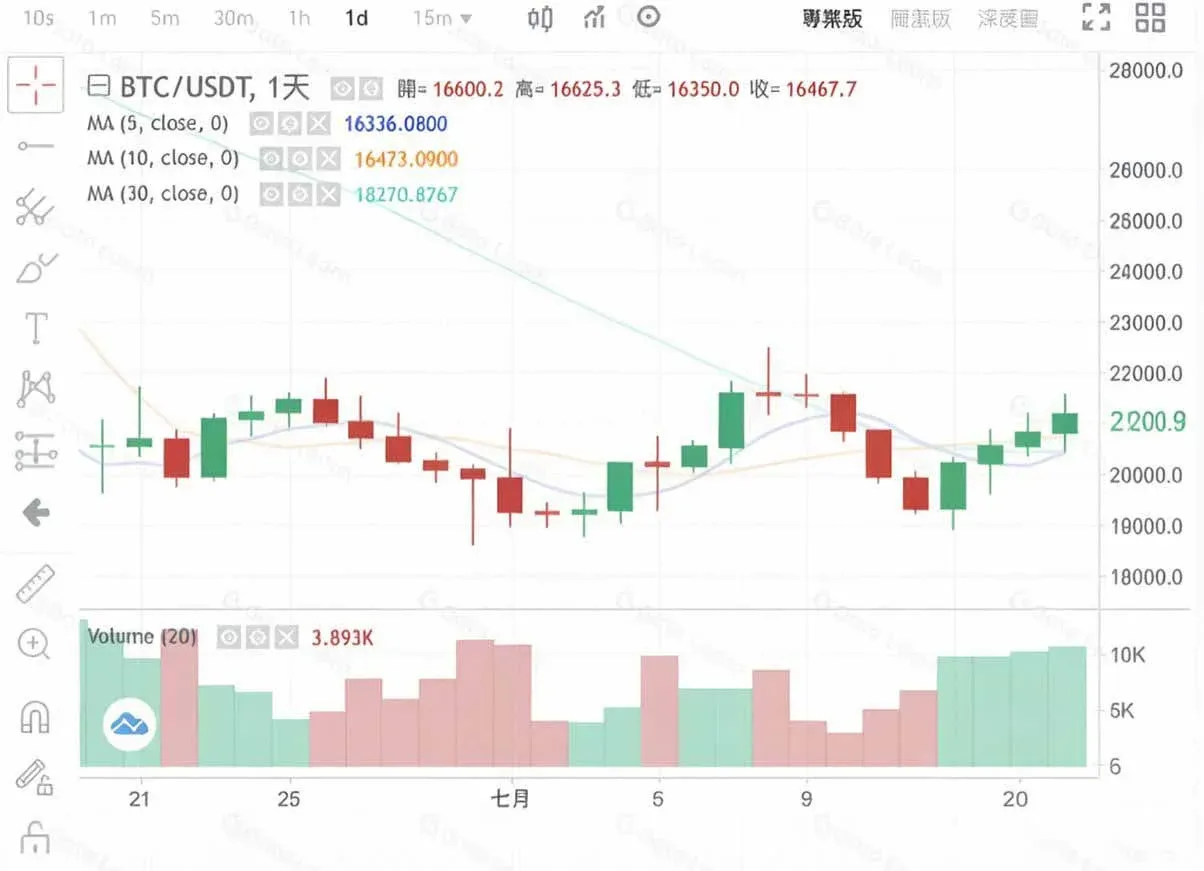
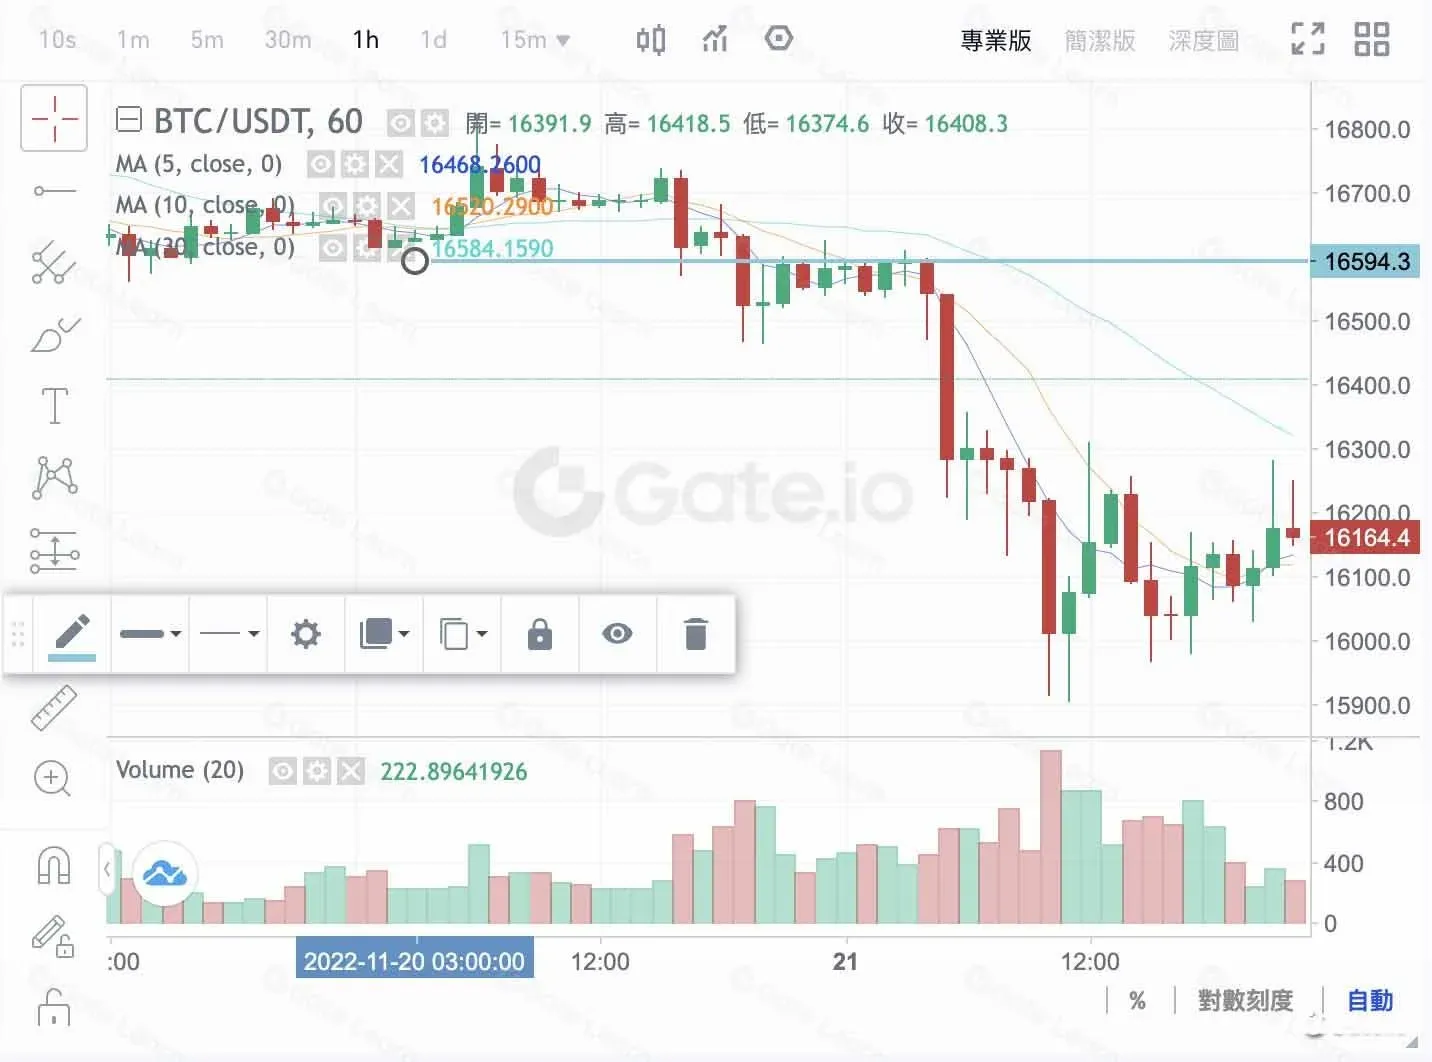
By Gate.com
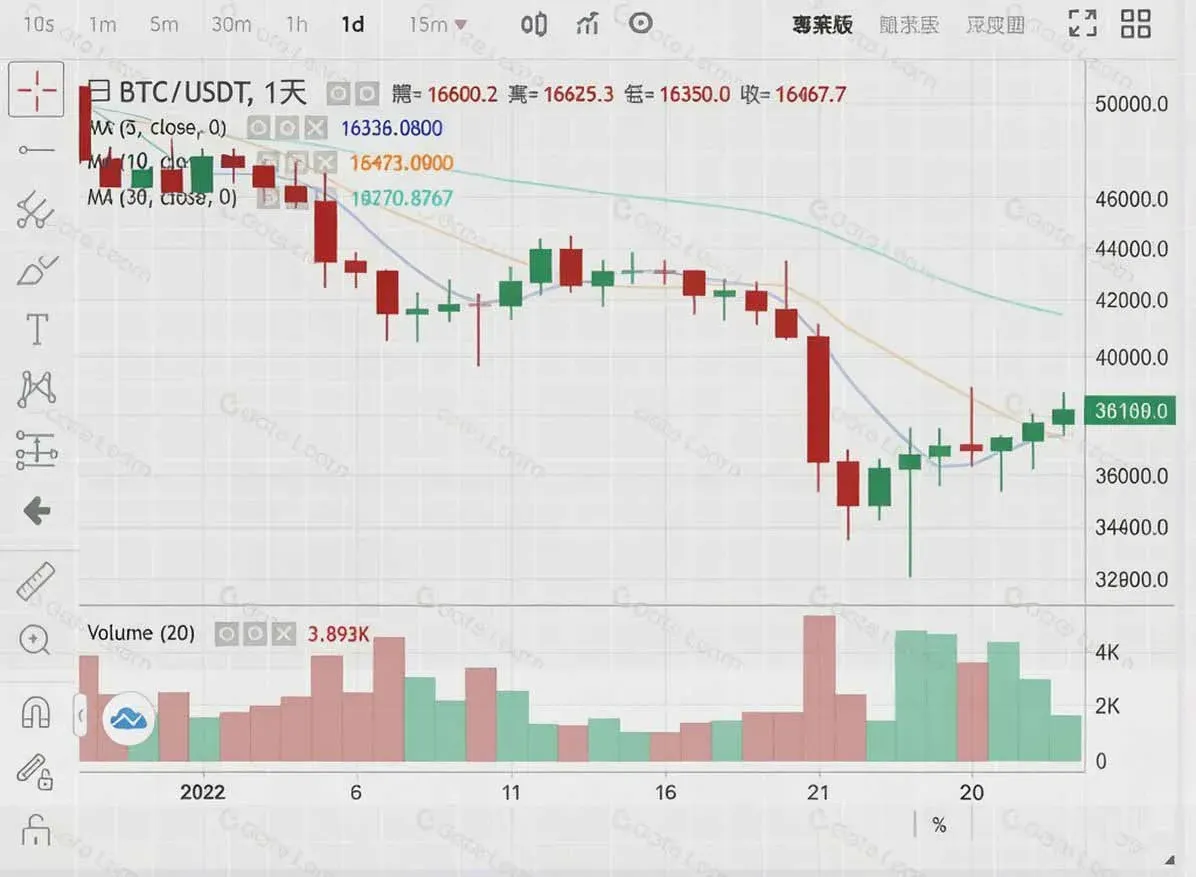
By Gate.com
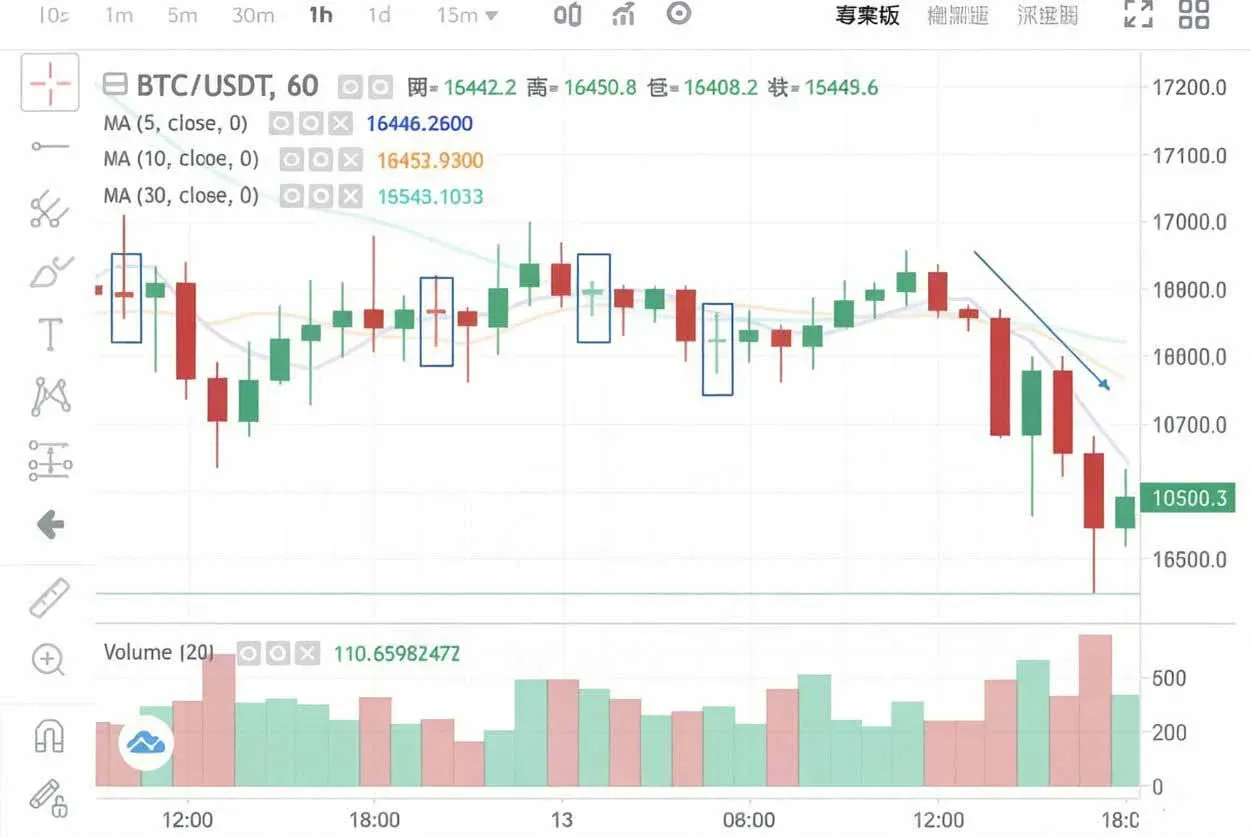
Multiple Dojis Indicating Market Indecision
When several Dojis appear within a short time span, it usually signals that the market is in a waiting phase and that a clear direction has not yet emerged. For example, ahead of a major news release, price may oscillate within a narrow band, producing a string of Dojis. In such situations, caution is advised and blind entries should be avoided.
Integrating Doji‑Based Reversal Signals Into a Trading Strategy
A Doji alone is not an all‑purpose indicator; traders should combine it with support/resistance levels, volume, and risk‑reward considerations to construct a higher‑probability plan. Common practices include:
- Confirm Support/Resistance: A Dragonfly Doji appearing at a key support level can be treated as a buying cue; a Gravestone Doji at a major resistance may suggest taking profit or placing a sell order.
- Time‑Frame Filtering: Dojis on higher time frames (daily, weekly) generally carry more weight than those on lower intervals.
- Pair With Other Reversal Patterns: When a Morning Star, Evening Star, or similar combination forms, the Doji acts like an “accelerator” for the overall signal.
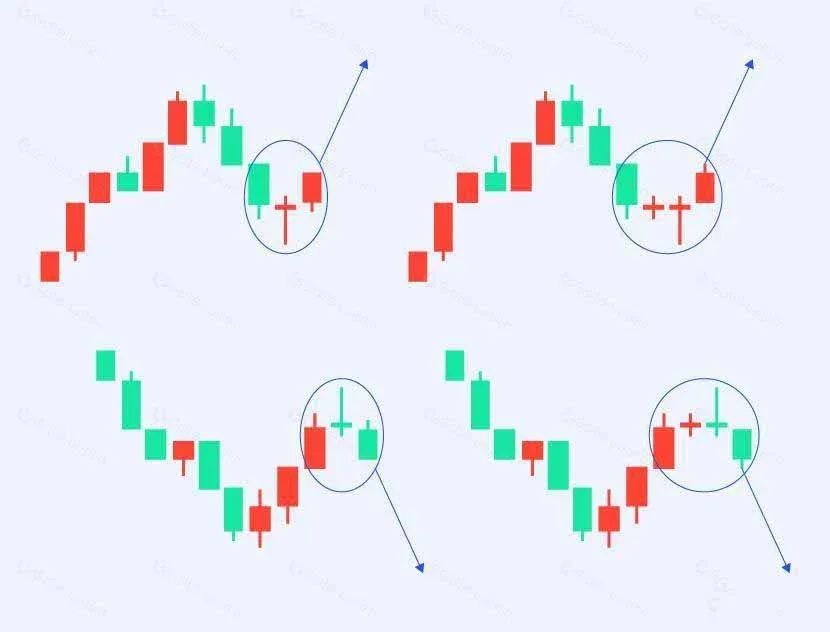
Example Walkthrough
In this case study, price is consolidating within a downtrend channel. A Doji appears first, followed shortly by an Evening Star, indicating that bearish pressure is gaining momentum. The subsequent break below the prior resistance line triggers a larger bearish candle, confirming the earlier reversal expectation.
Conclusion
The defining trait of a Doji is that the opening and closing prices are nearly identical, which is why it is classified as a neutral signal. Its practical meaning depends on where it occurs, the surrounding trend, and whether other technical tools confirm it. Relying on a Doji in isolation rarely yields a complete trading decision; it is advisable to consider volume, support/resistance zones, and longer‑term price action. Only when a Doji appears on high volume at a pronounced support or resistance level does it possess notable analytical value.
Dojis can help traders spot potential entry points, but they provide limited guidance on exit timing. If many Dojis cluster at the same price level, it usually reflects persistent market hesitation, reducing the reliability of the signal. Consequently, in real‑world trading, the Doji should be treated as an auxiliary tool for trend assessment rather than a sole basis for action.
*For global traders, fiat transactions are typically settled in USD, using SEPA or SWIFT channels for bank transfers. Residents of the United States should use Binance.US rather than the global Binance platform when accessing cryptocurrency markets.*
The complete discussion of “Doji Candlestick Full Guide: Pattern Types, Signal Meaning, and Practical Strategies” has now been presented. To explore more related content, you may search for previous Bitaigen (比特根) articles or continue browsing the links below. Thank you for following and supporting Bitaigen!
💡 Register on Binance with referral code B2345 for the maximum trading fee discount. See Binance complete guide.


