
From 2025 to 2050, analysts’ forecasts for Litecoin (LTC) prices vary widely, with short‑term estimates hovering around $120 and long‑term projections ranging from a few thousand dollars up to tens of thousands of dollars.
Litecoin (LTC) is one of the oldest and most stable cryptocurrencies, created as a faster alternative to Bitcoin. Because LTC has low fees and fast transaction speeds, it is widely used for payments and transfers. Investors often refer to it as “digital silver” due to its perceived long‑term store‑of‑value characteristics. This article analyses fundamental factors, technical trends, and provides LTC price forecasts while exploring its future outlook.

In this article we systematically review Litecoin’s fundamentals and technical aspects, combine long‑term perspectives from industry experts, and assess its potential trajectory and value role over the coming decades. By deep‑diving into supply‑demand dynamics, halving mechanisms, and ecosystem applications, readers can form a more comprehensive judgment. Subsequent sections will present detailed price‑range forecasts—please continue reading.
Key Points
- As of 2024‑02‑24, Litecoin (LTC) is priced at $123.22.
- The all‑time high of $401.47 occurred on 2021‑05‑09, while the all‑time low of $22.35 was on 2018‑12‑07.
- Launched in 2011, it is regarded as a Bitcoin alternative designed to improve transaction speed.
- Maximum supply is 84 million coins, creating scarcity that can positively affect long‑term price levels.
- Block rewards halve approximately every four years; the most recent halving took place in August 2023.
- Supported by major crypto platforms and accepted as payment by several companies.
Litecoin (LTC) Real‑Time Market Data
As of 2024‑02‑24, Litecoin (LTC) is trading at $123.22.
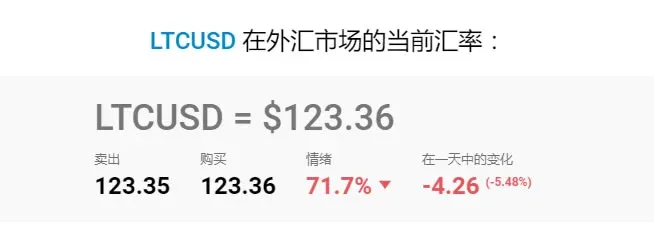
When analysing Litecoin, it is important to monitor market‑cap, trading volume, and the volume‑to‑market‑cap ratio—metrics that help gauge trading activity. The past year’s price volatility provides a reference for longer‑term trends, and the historical peak serves as a key benchmark.
Data as of 2025‑02‑09
| Metric | Value |
|---|---|
| Market Cap | $8.04 billion |
| 24‑hour Trading Volume | $1.32 billion |
| Volume‑to‑Market‑Cap Ratio | 15.25 % |
| All‑time High | $401.47 |
| Circulating Supply | 75.52 million |
| Max Supply | 84 million |
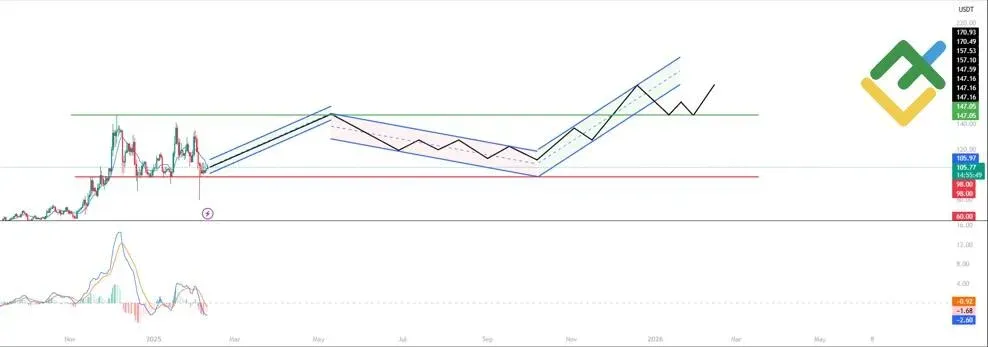
Technical‑Analysis‑Based 2025 Litecoin (LTC) Price Forecast
Key support lies in the $98‑$60 range; a break below could lead to further downside. If the price holds above the crucial resistance at $147, an upward trend may continue.
MACD Indicator
- The blue MACD line sits below the orange signal line but is rising gradually, suggesting diminishing bearish pressure.
- The histogram’s negative values are narrowing, which may hint at a price reversal to the upside.
The current CMC Crypto Fear & Greed Index is 35, indicating a fearful market that typically dampens price gains. However, if price retreats to a key support level (e.g., $98), buying pressure could be triggered, leading to a rebound.

Price‑Action Overview
- The level $136 has been tested repeatedly without a breakout, showing strong seller resistance.
- Each pull‑back has stayed above $98, indicating robust buyer demand.
- A consolidation phase suggests positions are being accumulated, leaving room for upside later.
Forecast Range
- First test the $106 support, then rebound toward $147.
- If the price stays above $147, a potential surge to $170 is possible.
- If selling pressure intensifies, a retracement to $98 or lower could occur.
| Month | Low (USD) | High (USD) |
|---|---|---|
| February | 106 | 147 |
| March | 105 | 130 |
| April | 127 | 140 |
| May | 136 | 148 |
| June | 136 | 120 |
| July | 120 | 127 |
| August | 123 | 127 |
| September | 111 | 122 |
| October | 123 | 133 |
| November | 127 | 147 |
| December | 147 | 170 |
2025 LTC/USD Long‑Term Trading Plan
Long‑Side Strategy
- Entry: Price returns to the $98‑$106 support zone.
- Signal: Support bounce confirmed by MACD or a surge in volume.
- Take‑Profit: $147, $157, $160.
- Stop‑Loss: Below $98.
Short‑Side Strategy
- Entry: Price reaches the $147‑$157 resistance zone.
- Signal: MACD turning down and volume expanding.
- Take‑Profit: $120, $106, $98.
- Stop‑Loss: Above $160.
The strategy focuses on range trading, paying close attention to breakouts and pull‑backs at key levels.
Analyst Forecasts for 2025 LTC Price
Different institutions provide varying range forecasts, reflecting divergent views:
CoinCodex
- Forecast range: $77.15‑$232.14 (as of 2025‑02‑09).
- Anticipates an up‑trend from February to May, peaking at $232.14, followed by a possible correction.
| Month | Low | Avg | High |
|---|---|---|---|
| February | 103.8 | 124.21 | 148.97 |
| March | 113.88 | 128.12 | 144.27 |
| April | 141.07 | 166.16 | 213.35 |
| May | 100.69 | 148.07 | 232.14 |
| June | 84.82 | 98.96 | 114.78 |
| July | 77.15 | 90.17 | 101.81 |
| August | 102.04 | 117.22 | 139.82 |
| September | 97.78 | 110.56 | 121.38 |
| October | 112.91 | 122.66 | 129.95 |
| November | 102.21 | 137.07 | 167.29 |
| December | 98.76 | 102.39 | 107.64 |
CryptoPredictions
- Forecast range: $89.18‑$155.69.
- Predicts a gradual strengthening starting in June.
| Month | Low | Avg | High |
|---|---|---|---|
| February | 90.91 | 104.76 | 115.42 |
| March | 89.18 | 102.99 | 115.11 |
| April | 92.35 | 105.16 | 116.48 |
| May | 90.24 | 105.74 | 119.25 |
| June | 92.16 | 111.27 | 127.43 |
| July | 106.16 | 119.28 | 131.20 |
| August | 105.01 | 124.73 | 140.83 |
| September | 114.22 | 133.45 | 147.96 |
| October | 116.91 | 132.95 | 145.81 |
| November | 121.25 | 139.93 | 155.69 |
| December | 117 | 136.92 | 153.21 |
Coin Republic
- Forecast range: $82.36‑$148.5.
- Expects steady growth throughout the year, approaching $148.5 by year‑end.
| Month | Low | Avg | High |
|---|---|---|---|
| February | 82.368 | 104 | 123.552 |
| March | 82.368 | 104 | 123.552 |
| April | 83.952 | 106 | 125.928 |
| May | 86.328 | 109 | 129.492 |
| June | 87.912 | 111 | 131.868 |
| July | 89.496 | 113 | 134.244 |
| August | 91.872 | 116 | 137.808 |
| September | 93.456 | 118 | 140.184 |
| October | 95.04 | 120 | 142.56 |
| November | 97.416 | 123 | 146.124 |
| December | 99 | 125 | 148.5 |
Analyst Overview for 2026‑2030 LTC Price Projections
| Year | Institution | Low (USD) | Avg (USD) | High (USD) |
|---|---|---|---|---|
| 2026 | Coin Republic | 101.37 | 142.00 | 191.26 |
| 2026 | CryptoPredictions | 117.59 | 179.01 | 242.89 |
| 2026 | CoinCodex | 41.37 | 61.48 | 100.36 |
| 2027 | Coin Republic | 129.88 | 182.00 | 244.72 |
| 2027 | CryptoPredictions | 191.62 | 343.93 | 381.84 |
| 2027 | CoinCodex | 50.31 | 62.05 | 78.00 |
| 2028 | Coin Republic | 166.32 | 233.00 | 312.44 |
| 2028 | CryptoPredictions | 301.68 | 475.00 | 622.89 |
| 2028 | CoinCodex | 49.03 | 60.68 | 92.31 |
| 2029 | Coin Republic | 213.04 | 298.00 | 400.35 |
| 2029 | CryptoPredictions | 490.18 | 706.13 | 906.73 |
| 2029 | CoinCodex | 52.33 | 90.61 | 186.93 |
| 2030 | Changelly | 622.14 | 831.78 | 1,061.00 |
| 2030 | CryptoPredictions | 685.59 | 1,103.00 | 1,480.49 |
| 2030 | CoinCodex | 21.25 | 34.37 | 72.07 |
Long‑Term Outlook Through 2050
- Changelly: $25,228‑$39,853 in 2040; $50,654‑$63,544 in 2050.
- Telegaon: $805.63‑$917.19 in 2035; $1,207.34‑$1,543.93 in 2040.
- CoinCodex: $12.62‑$29.61 in 2040; $2.92‑$9.81 in 2050.
| Year | CoinCodex (USD) | Telegaon (USD) | Changelly (USD) |
|---|---|---|---|
| 2035 | — | 869.84 | — |
| 2040 | 17.34 | 1,386.67 | 30,156 |
| 2050 | 5.18 | — | 54,912 |
Projections differ dramatically across research houses; a comprehensive assessment should consider macro‑economic conditions, industry competition, and technological evolution.
Social‑Media Sentiment on LTC
Social‑media chatter has a noticeable impact on Litecoin pricing. Positive or negative discussions can sway investor sentiment, which in turn influences price movements.
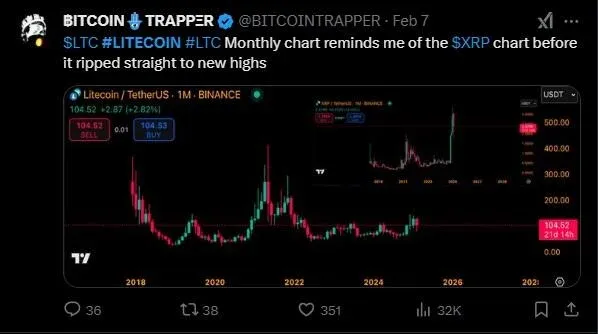
- User @BITCOINTRAPPER juxtaposed the LTC monthly chart with XRP’s surge, arguing that LTC’s outlook is bullish and could reach new highs.
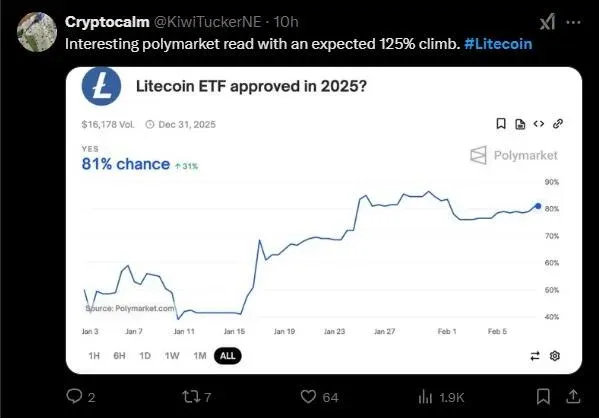
- Cryptocalm user @KiwiTuckerNE cited Polymarket data, claiming an 81 % probability that LTC will receive ETF approval in 2025, which could lift the price by roughly 125 %.
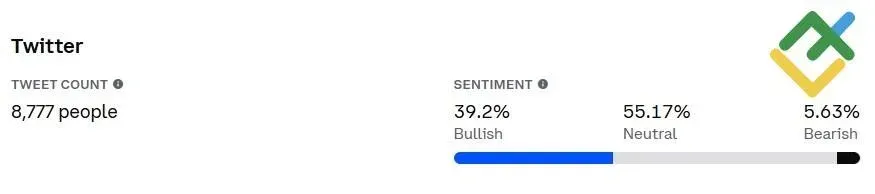
Statistics indicate that in the past 24 hours, Twitter saw 8,777 mentions of LTC, with 39.2 % bullish, 55.17 % neutral, and 5.63 % bearish sentiment.
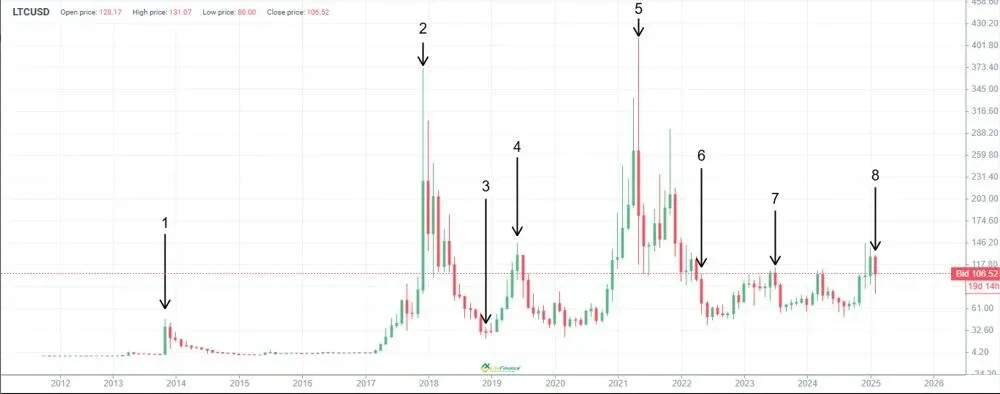
LTC Price History Recap
- All‑time high: $401.47 on 2021‑05‑09.
- All‑time low: $22.35 on 2018‑12‑07.
The past decade’s LTC/USD trajectory (chart omitted) includes:
- First break above $48 in 2013.
- Bull market in 2017 pushed price to $375.
- Bear market in 2018 dropped it to roughly $25.
- Anticipation of the 2019 halving lifted price to $140.
- New peak of $412 reached in 2021.
- Liquidity crisis in 2022 drove price down to $45.
- Post‑halving recovery in 2023 saw price rise to $110.
- On 2025‑02‑03, U.S. policy risk triggered a 27 % pullback.
Fundamental Analysis Highlights
Key Drivers Influencing LTC Price
- Overall crypto‑market trend: Bitcoin’s performance often cascades into altcoins.
- Media sentiment: Positive or negative coverage directly affects investor mood.
- Geopolitics & regulation: Sanctions and policy shifts can alter demand.
- Payment‑system integration: Wider merchant adoption boosts usage.
- Halving events: Reduced supply tends to support price.
- User activity: Growth in transaction count and unique addresses signals network health.
- Trading volume: High volume generally reflects stronger liquidity and market interest.
Note: Crypto gains may be taxable in many jurisdictions. Users should consult local tax regulations and consider using SEPA or SW
Related Reading
- Litecoin (LTC) Overview: Halving, Price Trends & Future Roadmap
- Litecoin (LTC) Technical Analysis, Upgrades & Future Outlook
- Litecoin (LTC) Zero Risk? 2026 Technical & Market Review
💡 Register on Binance with referral code B2345 for the maximum trading fee discount. See Binance complete guide.
⚠️ Risk Disclaimer: Crypto prices are highly volatile. This is not investment advice.


