
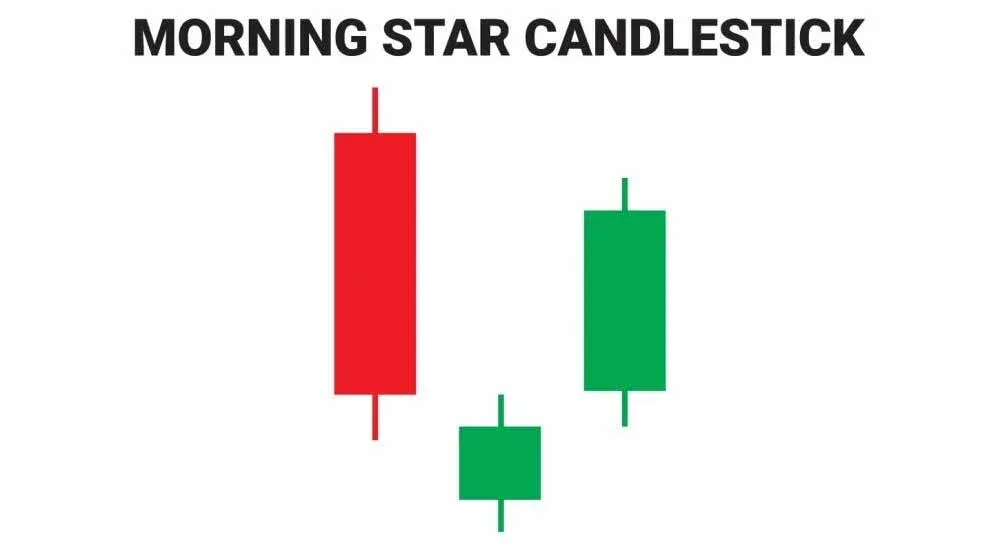
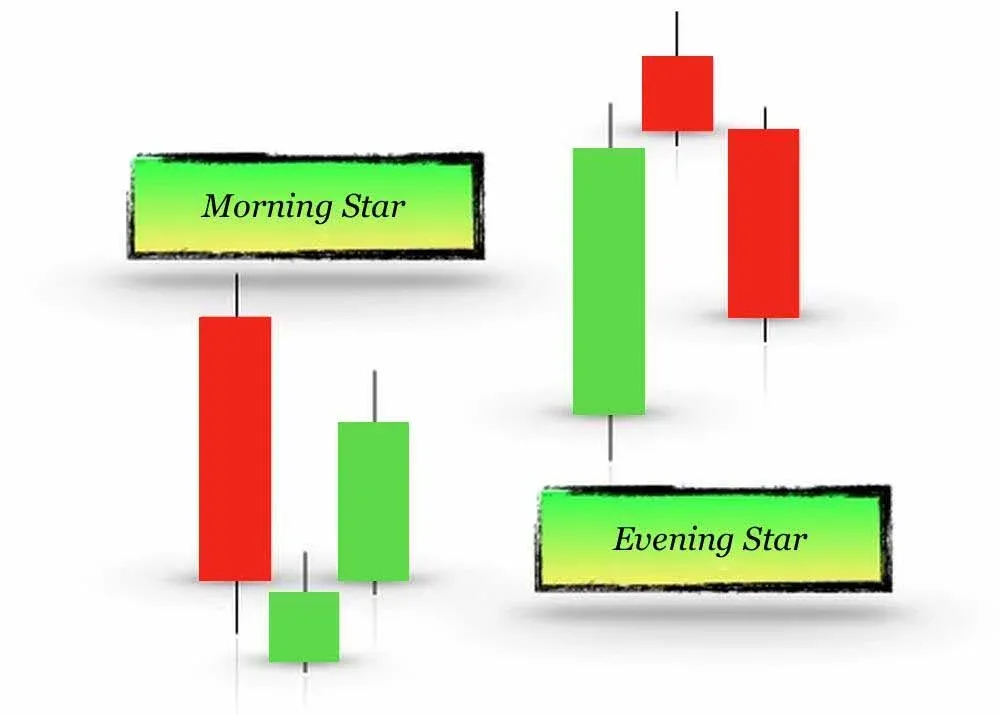
Japan’s candlestick charts are popular among traders because they display price action clearly and can generate trading signals. There are many candlestick patterns, and the Morning Star is a common bullish reversal formation. It consists of three candles: a long bearish candle, a short‑bodied candle in the middle (which may be red or green), and a long bullish candle. When this pattern appears, it often signals that a downtrend is about to end and that prices may turn upward.
In this article we systematically break down the components and identification techniques of the Morning Star pattern, analyze its applicability and limitations across different timeframes and markets, and objectively evaluate its pros and cons. This helps traders recognize potential bullish signals and provides practical ideas for combining the pattern with other tools. To learn how to capture this reversal signal in live trading, keep reading.
Key Takeaways
Topic
Core Points
- What is a Morning Star?
A bullish reversal pattern composed of a long bearish candle, a short‑bodied candle (or doji), and a long bullish candle.
- Impact on price
When the pattern forms, it usually forecasts a shift from a falling to a rising trend, with the market potentially entering an up‑move.
- Trading idea
After the pattern is confirmed, a trader may consider opening a long position near a key support level, targeting recent resistance zones.
- Identification cues
Appears at the bottom of a downtrend, often with gaps between the three candles, and the middle candle has a small body.
- Pros and cons
Works across many financial markets and timeframes, and is relatively easy to spot; however, on low‑timeframe charts it can be noisy and usually benefits from confirmation by other patterns or indicators.
What Is a Morning Star?
A Morning Star is a three‑candle reversal formation that typically shows up at the bottom of a downtrend. The first candle is a sizable bearish candle, indicating that sellers still dominate. The second candle is a short‑bodied candle (it may also be a doji) that shows weakening bearish pressure. The third candle is a long bullish candle that confirms buyers have taken control again. If the middle candle has no real body at all, the pattern is called a Morning Star Doji, which delivers an even stronger signal.
Detailed Formation Process
- First bearish candle – Price keeps falling, and sellers are in charge.
- Star candle – A small‑bodied candle appears, often with a downward gap, indicating that bearish pressure is easing and the market is reaching a balance.
- Closing bullish candle – A long bullish candle follows, usually opening with an upward gap and closing well above the bodies of the first two candles, signalling the return of buying power.
How to Spot a Morning Star on a Chart
- The pattern must appear at the end of a clear downtrend or at the bottom of a long‑lasting consolidation zone.
- The first candle should be a long bearish candle.
- A downward gap often separates the first and second candles.
- The second candle has a short body; its colour is not fixed and it may be a doji.
- An upward gap may follow the second candle, reinforcing the formation.
- The third candle must be a long bullish candle that covers at least 50 % of the first candle’s body. The larger the coverage, the stronger the pattern.
- Once completed, the market typically continues higher in the following sessions, establishing an uptrend.
Illustrative Examples
1. Crude Oil (USCRUDE) – 30‑minute Intraday Chart
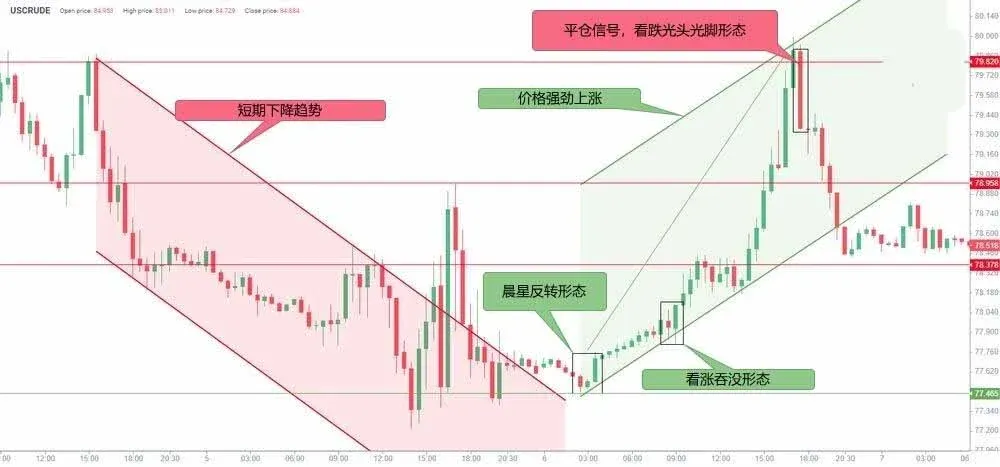
After a brief dip, price broke the upper band and formed a Morning Star. A bullish engulfing pattern then appeared, pushing the price sharply higher. If a naked bearish pattern emerges around the $79.82 resistance level, that could be taken as a signal to exit the position.
2. GBP/USD – 4‑Hour Medium‑Term Chart
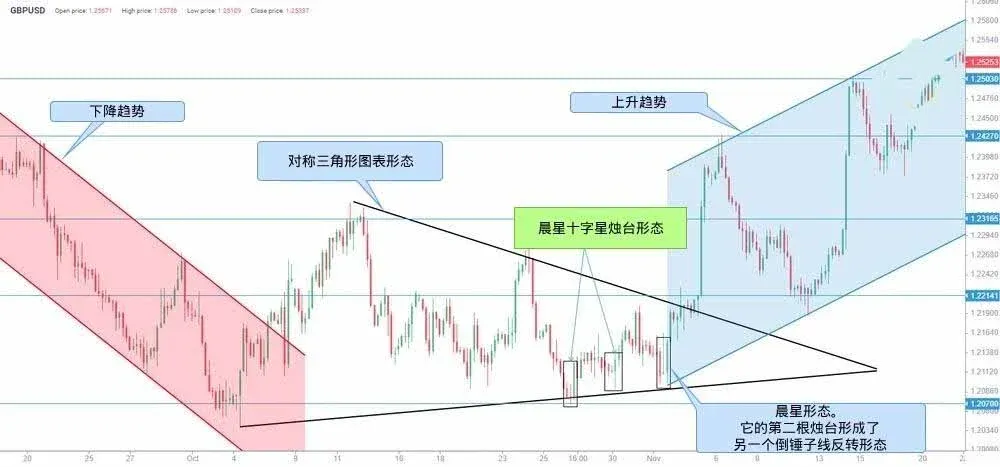
Following a prolonged decline, multiple Morning Star Dojis and inverted hammers formed inside a symmetrical triangle. The price then broke the $1.2214 resistance level and surged upward rapidly.
3. Bitcoin (BTCUSD) – 4‑Hour Chart
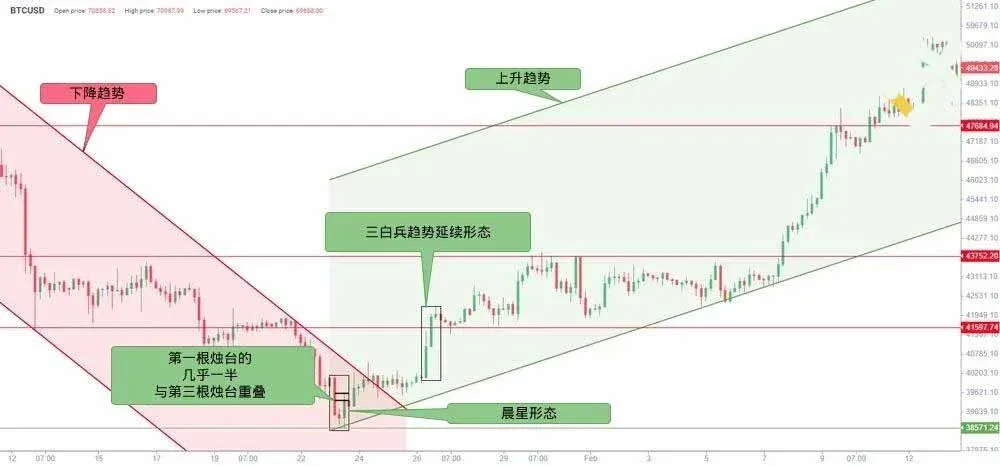
Even though the third bullish candle did not fully cover half of the first bearish candle, the pattern still indicated the start of a new up‑move, later confirmed by a “Three White Soldiers” formation.
4. Starbucks (SBUX) – Daily Long‑Term Chart
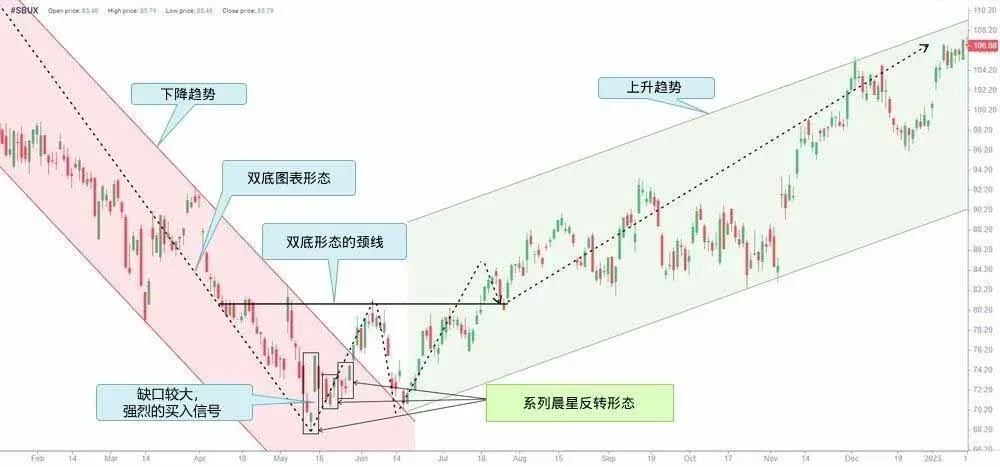
After a double‑bottom formation, several Morning Stars appeared. The third bullish candle featured a large upward gap, strongly hinting at a trend reversal.
Practical Trading Strategies
1. Entry Based on Support Levels
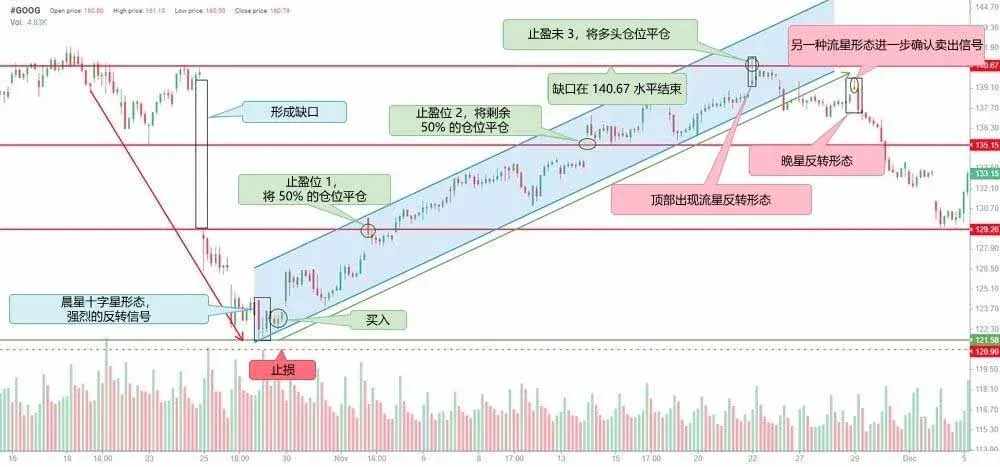
Using the hourly chart of Alphabet (GOOGL) as an example, after a gap the price retraced to the $121.58 support level and produced a Morning Star Doji. A long position could be taken near this support. Target levels might be set at $129.26, $135.15, and $140.67, with a stop‑loss placed just below the support. If the price reaches $140.67 and a Shooting Star or Evening Star pattern forms, the trader may consider closing the position.
2. Confirmation with Other Candlestick Patterns
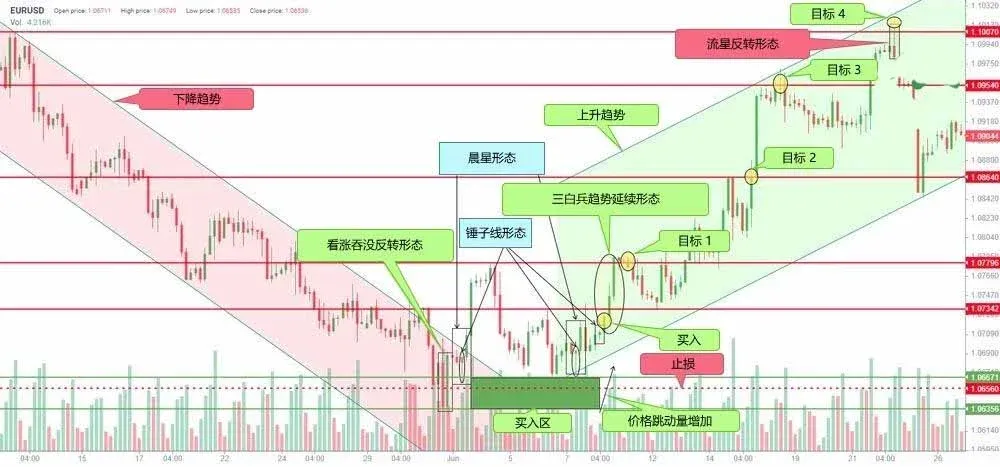
On the EUR/USD 4‑hour chart, a bullish engulfing pattern first confirmed the reversal, followed by two Morning Stars combined with hammer candles and a Three White Soldiers formation, further validating the uptrend. An entry around 1.0734 could be made, with staged profit targets at 1.0779, 1.0864, 1.0954, and 1.1007, and a stop‑loss placed below 1.0667. A subsequent Shooting Star would signal an exit.
3. Integrated Strategy with Technical Indicators and Major Trend Patterns
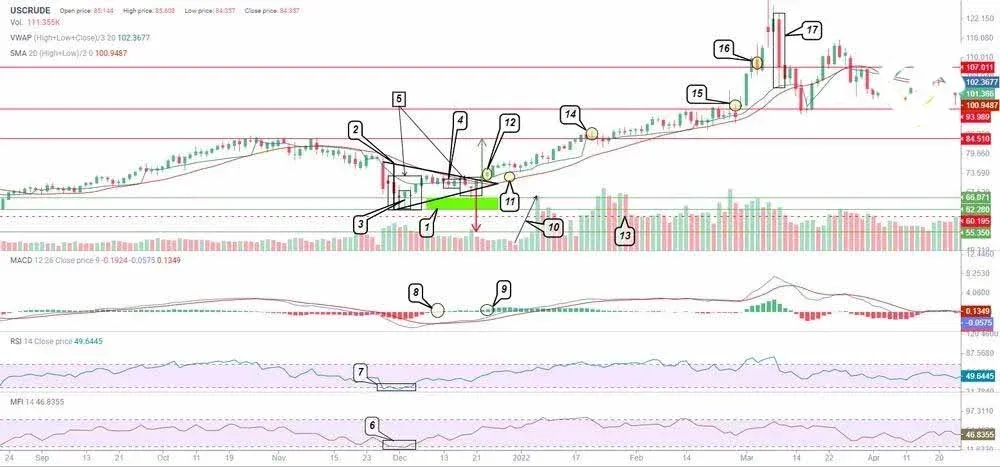
On the USCRUDE daily chart, the RSI, MFI, MACD, VWAP, and SMA‑20 indicators are used in conjunction. The indicators show an oversold condition rebounding upward, MACD crossing above the zero line, and expanding volume— all supporting an uptrend after the Morning Star. Entry, stop‑loss, and tiered profit levels are set based on support/resistance zones, symmetrical triangle breakouts, and other larger chart patterns.
Morning Star vs. Evening Star
| | Morning Star | Evening Star |
|----------------|------------------|------------------|
| Typical location | Bottom of a downtrend | Top of an uptrend |
| Signal direction | Trend shifts from down to up | Trend shifts from up to down |
| First candle | Bearish candle | Bullish candle |
| Third candle | Bullish candle | Bearish candle |
| Second candle | Short body or doji, any colour | Same as left |
| Stop‑loss suggestion | Place below the support zone | Place above the resistance zone |
Pros and Cons Summary
Advantages
- Captures reversal opportunities at trend bottoms, allowing traders to enter at more favorable prices.
- Applicable to forex, equities, futures, cryptocurrencies, and other asset classes.
- Works on timeframes from M5 up to monthly (MN); higher timeframes give stronger signals.
- The pattern itself suggests clear entry, stop‑loss, and target zones.
- Visually straightforward, making the learning curve relatively gentle.
Limitations
- Low‑timeframe charts (e.g., M5, M15) are prone to market noise, leading to false positives.
- For higher reliability, the pattern is usually combined with other candlestick formations, chart patterns, or technical indicators for secondary confirmation.
Conclusion
The Morning Star is a classic Japanese candlestick reversal pattern that indicates price has reached a low and may soon embark on an upward trajectory. It can be observed across most financial markets and is identifiable on a wide range of timeframes. When the Morning Star is used together with other patterns and technical tools, the accuracy of trading decisions and profit potential can be enhanced.
Frequently Asked Questions
Is the Morning Star a bullish pattern?
Yes. It suggests that a downtrend is about to end and that buying pressure is taking over.
What is the visual difference between a Morning Star and an Evening Star?
A Morning Star appears at the bottom of a downtrend and consists of a long bearish candle, a short‑bodied (or doji) candle, and a long bullish candle. An Evening Star appears at the top of an uptrend, with the structure reversed: a long bullish candle, a short‑bodied (or doji) candle, and a long bearish candle.
What factors affect the reliability of the signal?
The time‑frame is crucial; higher timeframes generally produce more dependable reversal signals. Nonetheless, confirmation with other patterns or indicators is advisable.
How often does the pattern occur?
Because price moves in cycles, Morning Stars can appear on any timeframe; their frequency varies with market volatility.
How many days does a Morning Star take to form on a daily chart?
In the classic definition each of the three candles occupies one day, so three consecutive days are sufficient; in some cases the formation may stretch over a longer period.
For further reading on the Morning Star, you can search for “Bitaigen” (比特根) to find additional articles. Happy trading!
*Note: Cryptocurrency gains may be taxable in your jurisdiction. Users in the United States should use Binance.US for fiat‑crypto transactions, while global users can use Binance.com and settle fiat via SEPA or SWIFT where applicable.*
💡 Register on Binance with referral code B2345 for the maximum trading fee discount. See Binance complete guide.


