
 Bitaigen Research
Bitcoin has slipped below the key $84,000 support level and is expected to continue its downward trajectory in the near term, with a target range between $50,000 and $58,000. In the event of a sharp sell‑off, the price could even breach the $50,000 mark.
In the worst‑case scenario, because Bitcoin failed to hold the important $84,000 support, the price may tumble to as low as $50,000.
Bitcoin (BTC) finally broke the crucial $84,000 support that had held since mid‑November 2025. Where will the price head next?
In this article we outline the market‑structure changes that followed Bitcoin’s break of the key support level, and dissect the latest standoff between bulls and bears. By combining technical analysis with on‑chain and funding‑flow perspectives, we aim to help readers assess potential range‑bound moves and risk points, providing a useful reference for the next steps.
Key Takeaways
- A $1.6 billion long‑position liquidation pushed Bitcoin down to a two‑month low of $81,000 on Thursday.
- Some analysts forecast that the bear market will extend further, with a target corridor of $50,000 – $58,000.
Bitcoin Sentiment Hits Historic Lows, New Bull Run Unlikely
On Thursday’s US equity close, Bitcoin kept selling, slipping to a two‑month low of $81,000.
The $87,000 opening level at the start of 2026, the 100‑day moving average, and the $84,000‑$86,000 demand‑zone support all gave way after the crypto market experienced more than $1.6 billion in long‑position liquidations, of which Bitcoin liquidations alone exceeded $750 million, driving the price down to $81,000.
Risk‑aversion is now at a fever pitch; the investor sentiment index fell from 26 yesterday to 16, entering the “extreme fear” zone.
Update: The Crypto Fear & Greed Index dropped to 16, indicating further deterioration in market mood compared with yesterday’s 26, now deep in extreme fear. pic.twitter.com/TdN5RZo6OR
— Cointelegraph (@Cointelegraph) Jan 30 2026
Crypto Town Hall analyst noted:
“The Bitcoin Fear & Greed Index has fallen to 16, which signals extreme fear. Historically, this level coincides with heavy volatility or leveraged unwindings, creating a strong flight‑to‑safety and cut‑loss environment.”
Economist Timothy Peterson added that consumer sentiment is approaching historic lows, with the five‑year average hitting a new trough.
He wrote on X:
“In an environment like this, nobody is buying Bitcoin or any risky asset. Only after a sentiment reversal will a new cycle emerge.”
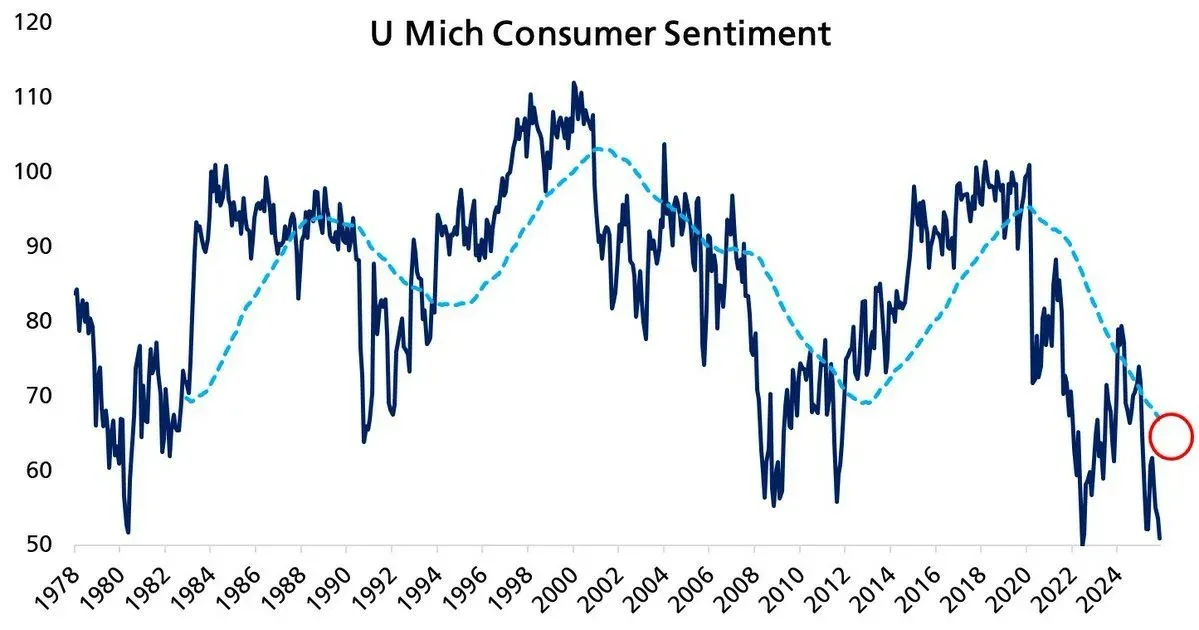
Bitcoin consumer‑sentiment index. Source: Timothy Peterson
Cointelegraph previously reported that investors’ “extreme fear” mirrors the painful market conditions seen after the FTX collapse, suggesting that a short‑term Bitcoin price reversal looks unlikely and uncertainty remains high.
Analysts: Bitcoin Could Bottom Near $50,000
With market sentiment continuing to deteriorate, analysts broadly agree the bear market will linger longer and may target lower levels.
- Daan Crypto Trades (trader and analyst) points out that the 200‑week moving average “has historically been a premium zone for long‑term accumulation on dips.”
He posted on X on Friday: “The closer you get to these averages when buying the dip, the better the risk‑reward.”
The 200‑week moving average currently sits at $57,974, aligning precisely with the lower‑bound “bear‑flag” target (see chart below). A drop to that level would represent a roughly 30.5 % decline from the current price and a 54 % retracement from the all‑time high of $126,000.
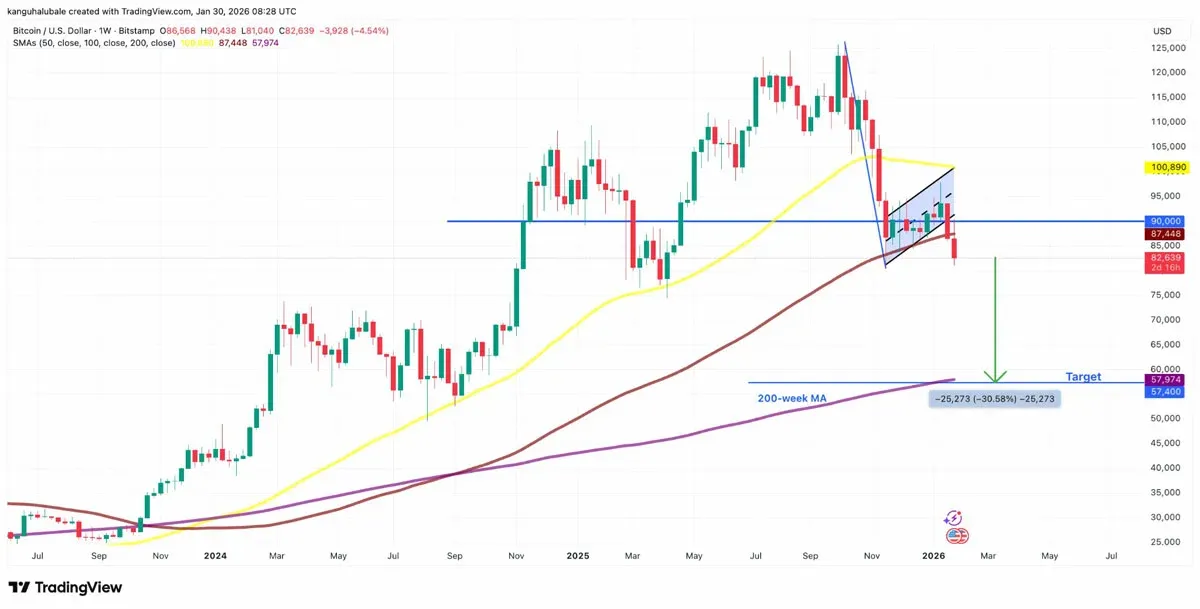
*BTC/USD weekly chart.* Source: Cointelegraph/TradingView
Analyst Keith Alan observes that Bitcoin’s weekly price action now resembles the 2021‑2022 period.
“Bitcoin may experience a short‑term bounce near the low‑end of the correction, but overall this bear market could persist longer.”
Alan notes that in April 2025 Bitcoin fell to the $74,500 range amid the U.S. President Trump “Freedom Day” tariff announcement. Absent a major positive catalyst, he expects Bitcoin/USD to eventually slip below $74,000 and further test the 2021 historic high of $69,000.
“If the slow decline only materialises in August, I’d be more optimistic,” Alan said, adding, “If a rapid dip occurs in February, the $50,000 zone later this year will become a key watch‑point.”
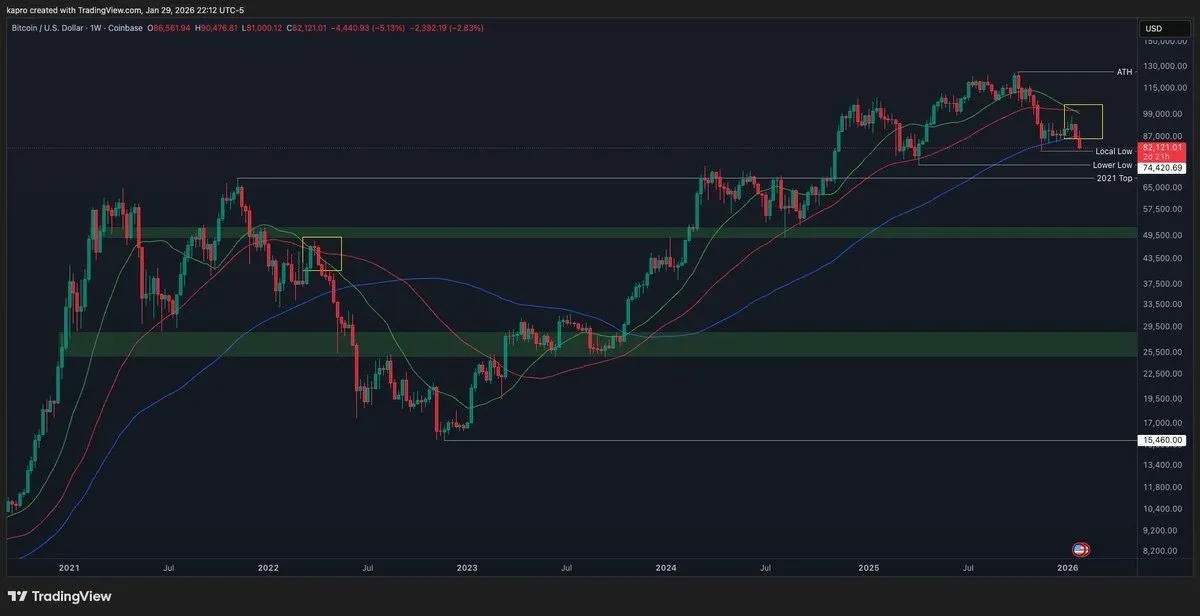
*BTC/USD weekly chart.* Source: X/Keith Alan
As previously reported by Cointelegraph, many analysts still view 2026 as a bear market year, with consensus forecasts placing Bitcoin’s floor around $58,000.
This concludes the detailed analysis of Bitcoin losing the critical $84,000 support level: How low could BTC fall? For more information on Bitcoin breaking $84k and where the $70k floor might be, follow other related articles on Bitaigen (比特根).
*Note: For fiat transactions, USD deposits and withdrawals are commonly processed via SEPA or SWIFT. U.S. residents should use Binance.US rather than the global Binance platform. Crypto gains may be taxable in your local jurisdiction; consult a tax professional for guidance.*
Related Reading
- Bitcoin Analysis: Trump Media's $2B BTC Purchase Shows Loss
- Bitcoin 2026 Forecast: $64K‑$65K Support & Market Sentiment
- Bitcoin Price Jan 3 2024: Real‑Time $45,233 Chart, 24‑Hour Change & Weekly Trend
💡 Register on Binance with referral code B2345 for the maximum trading fee discount. See Binance complete guide.



