
 Bitaigen Research
Bitcoin (BTC) has recently attracted intense market attention. Multiple core valuation metrics indicate that the asset may have entered an “undervalued zone,” and localized bottoming signals are beginning to emerge.
Bitcoin MVRV Ratio (Market Value to Realized Value) has now fallen below its 365‑day moving average, sitting around 1.9. Historical data show that the indicator at this level typically signals that the market is forming a “cyclical bottom” or a localized trough. With speculative leverage being cleared and long‑term holders re‑accumulating, Bitcoin’s price action beneath the $110,000 mark is being viewed as a potential recovery signal.
During the current volatile correction phase of the crypto market, accurately capturing bottoming signals in asset valuation is crucial. This article conducts an in‑depth analysis of the core on‑chain metric MVRV Ratio, exploring the cyclical recovery signal released after the metric breached a key moving average. By combining historical data with macro‑level fund flows, we interpret the market’s potential trajectory after leverage has been cleared. We hope this analysis helps you discern Bitcoin’s valuation repair logic and its true value range amid a complex macro environment.
Key Takeaways
- MVRV Ratio has slipped below the 365‑day SMA; historically this signal often precedes a strong rebound.
- Analysts point out that a rotation of capital from the gold market to the crypto market could act as a catalyst for BTC price recovery.
- Macro‑economic data (e.g., CPI) and interest‑rate‑cut expectations will continue to influence Bitcoin’s short‑term price action.
Bitcoin MVRV Indicator Emits a “Localized Bottom” Signal
MVRV Ratio (Market Value to Realized Value) is a widely‑used gauge of Bitcoin’s market valuation. According to the latest report from CryptoQuant analyst ShayanMarkets, the metric has recently breached its 365‑day simple moving average (SMA). The current MVRV Ratio hovers around 1.9, which is typically interpreted as a sign that the asset is undervalued.
Historical records demonstrate that a dip below the 365‑day SMA often identifies a highly referable buying zone:
| Occurrence | Subsequent Price Performance |
|---|---|
| Mid‑2021 | Follow‑on rally of roughly **135 %** |
| June 2022 | Follow‑on rally of roughly **100 %** |
| Early 2024 | Follow‑on rally of roughly **196 %** |
This persistent pattern suggests that Bitcoin has re‑entered an undervalued phase, during which long‑term holders (LTH) usually begin strategic accumulation. As Bitcoin’s price retreated from its all‑time high of $126,000 to around $103,530, the falling MVRV Ratio also reflects a reduction in speculative excess and a gradual strengthening of bottom support.
Analysts note that if the metric rebounds from its current level, it would confirm that recent selling pressure was part of a cyclical bottom formation and would underpin a bullish outlook for Q4. Should historical trends repeat, Bitcoin’s short‑term target could aim for $115,000, while the late‑stage bull market could potentially test $190,000.
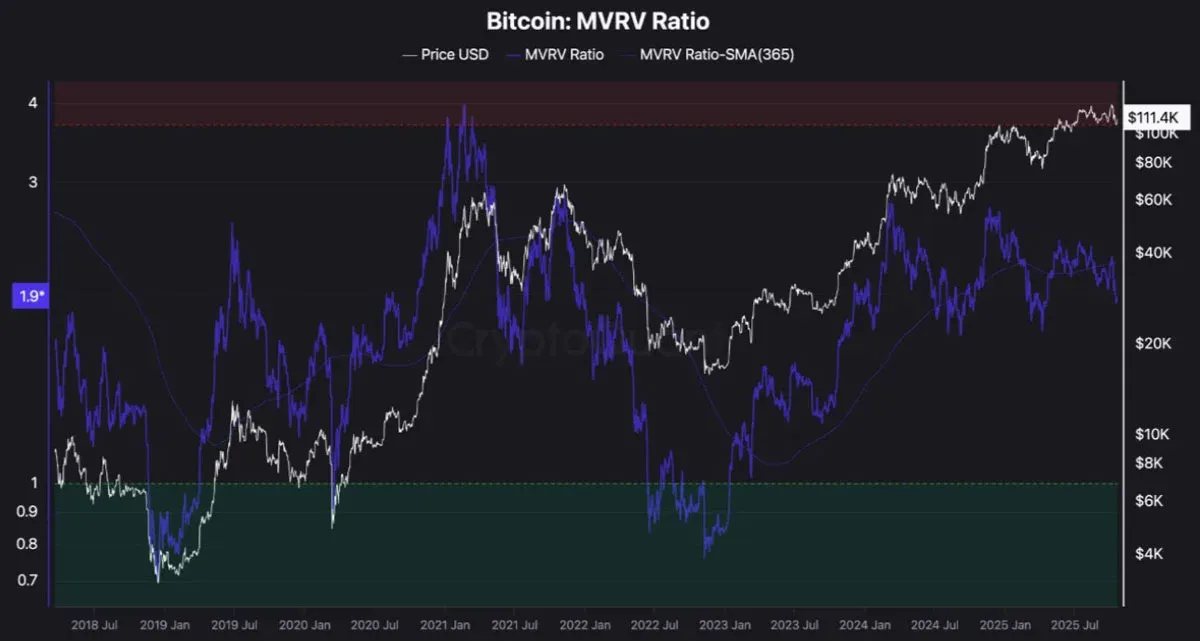
*Bitcoin MVRV Ratio chart. Source: CryptoQuant*
Capital Rotation From Gold May Boost BTC Prices
A pullback in gold prices could be beneficial for Bitcoin. Data from Cointelegraph Markets Pro and TradingView show that after reaching a historic high of $4,380, gold has recently declined by roughly 8.5 %.
Michaël van de Poppe, founder of MN Trading Capital, observes that gold is undergoing a “sharp correction.” He believes that if gold confirms a temporary top, the safe‑haven capital and liquidity that were flowing into gold may shift toward Bitcoin and other cryptocurrencies.
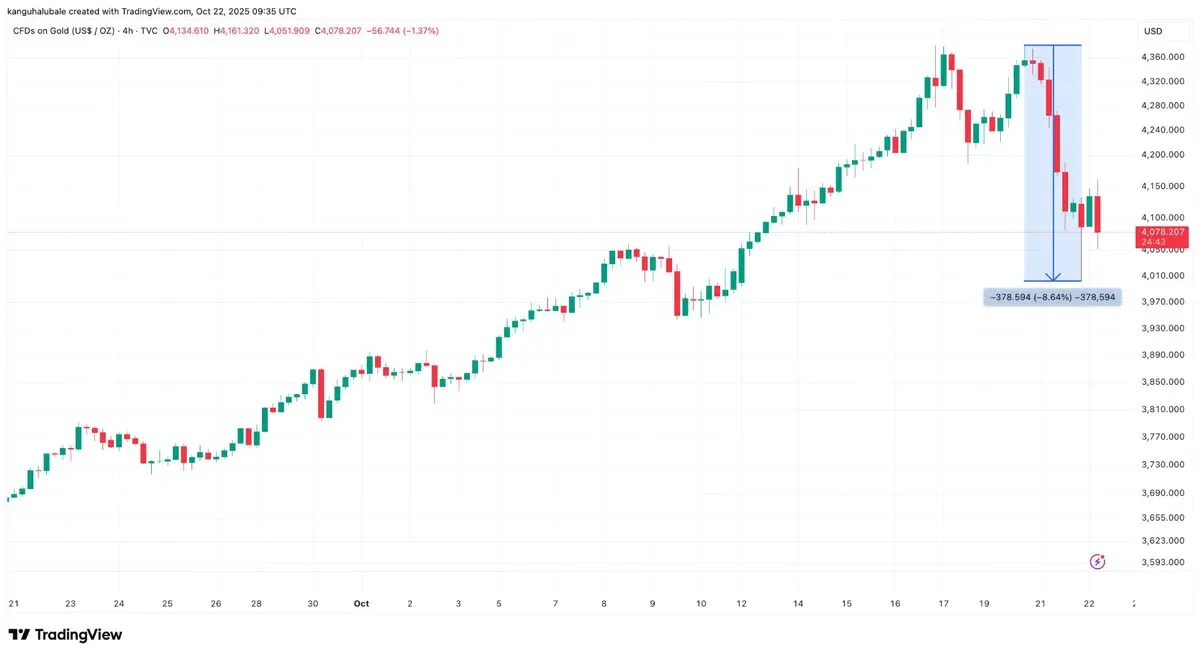
*Gold/USD (XAU/USD) 4‑hour chart. Source: TradingView*
On the macro side, markets are closely watching the U.S. Consumer Price Index (CPI) report due from the Bureau of Labor Statistics. Moderately low CPI figures typically reinforce expectations of a Federal Reserve rate cut.
“Mild CPI data will fuel expectations of a rate cut. As risk‑on sentiment returns, Bitcoin could kick off a new rally.”
Furthermore, analysts at Bitwise have presented a forward‑looking scenario: if 5 % of global gold‑market capital were to migrate into Bitcoin, BTC could be propelled toward $242,391.
Currently, several institutions hold an optimistic view of Bitcoin’s year‑end performance. Technical forecasts suggest that, with capital rotation and clearer macro policy, Bitcoin could rebound to a range of $150,000 – $165,000 by the end of the year.
The above provides a detailed, in‑depth analysis of how Bitcoin’s (BTC) MVRV Ratio indicates that a “cyclical bottom” is forming below the $110,000 level.
---
Localization Note: All fiat references are expressed in U.S. dollars (USD). For cross‑border fiat transfers, SEPA (for euros) or SWIFT (for other currencies) are the standard channels. U.S. residents wishing to trade Bitcoin should use Binance.US rather than the global Binance platform. Crypto gains may be subject to taxation in your jurisdiction; consult a tax professional for guidance.
Related Reading
- Bitcoin On-chain Analysis: MVRV Ratio and NUPL Guide
- Bitcoin Identity Crisis: Dropping Safe‑Haven Appeal
- Bitcoin Returns to $90K, BlackRock ETF Investors Profit
💡 Register on Binance with referral code B2345 for the maximum trading fee discount. See Binance complete guide.



