
 Bitaigen Research
 Understanding Bitcoin (BTC) Price Retesting the $111,000 Support: RSI Indicator Suggests Growing Bullish Momentum

Bitcoin has entered a high-level consolidation phase after achieving recent price all-time highs, seeking to establish a local bottom by retesting critical support levels. Current market signals indicate that favorable RSI (Relative Strength Index) signals are beginning to resonate with expectations of Federal Reserve interest rate cuts, providing a foundational floor for subsequent price action.
Bitcoin (BTC) is currently in a price consolidation phase, with a focus on retesting key support levels at $111,000 (the 21-week EMA) and $114,500. Although high-cycle RSI signals suggest that momentum may be nearing exhaustion, "hidden bullish divergence" in shorter timeframes indicates that buying demand remains robust. If BTC can successfully hold these aforementioned supports, it is well-positioned to extend its upward trend and challenge even higher price targets.
After refreshing its record highs, Bitcoin has stepped into a pivotal period of volatility and consolidation, as the market seeks a new equilibrium by repeatedly testing support levels. In this article, we will take a deep dive into the momentum signals behind the RSI indicator and analyze the resonance between technical structures and the macro policy environment. In a landscape where high and low timeframe signals are intertwined, can the bulls hold the critical defensive line? Our goal is to provide a deep analysis to help readers perceive the genuine demand behind price fluctuations and grasp the potential trajectory of the next market movement.
Core Key Points of This Article:
- Support Confirmation: Bitcoin is currently confirming a local bottom, with analysts focusing on key support lines such as $111,000 and $114,500.
- Momentum Analysis: The RSI indicator shows that demand is persisting, though concerns regarding trend exhaustion remain within the longer-term timeframe frameworks.
- Macro Environment: The Federal Reserve's upcoming interest rate decisions have begun to influence US equity performance, leading to a cooling of market risk appetite ahead of the FOMC meeting.
Bitcoin (BTC) tested key resistance levels on Tuesday, and despite increased market volatility, the majority of traders remain optimistic about the medium-to-long-term upward price trend.
According to data from Cointelegraph Markets Pro and TradingView, the Bitcoin price is currently fluctuating within a narrow range around the $114,500 zone. Following a strong weekly close, BTC/USD entered a phase of gain consolidation during Monday’s Wall Street trading session. For global investors looking to enter the market, standard fiat gateways such as SEPA for European users or SWIFT for international transfers remain the primary methods for funding accounts. It is important to note that while global users may access various platforms, users based in the United States must utilize Binance.US rather than the global Binance platform to comply with local regulations. Furthermore, investors should be aware that cryptocurrency gains may be subject to capital gains tax depending on their local jurisdiction.
Bitcoin Price Structure Hints at a Challenge to New Highs
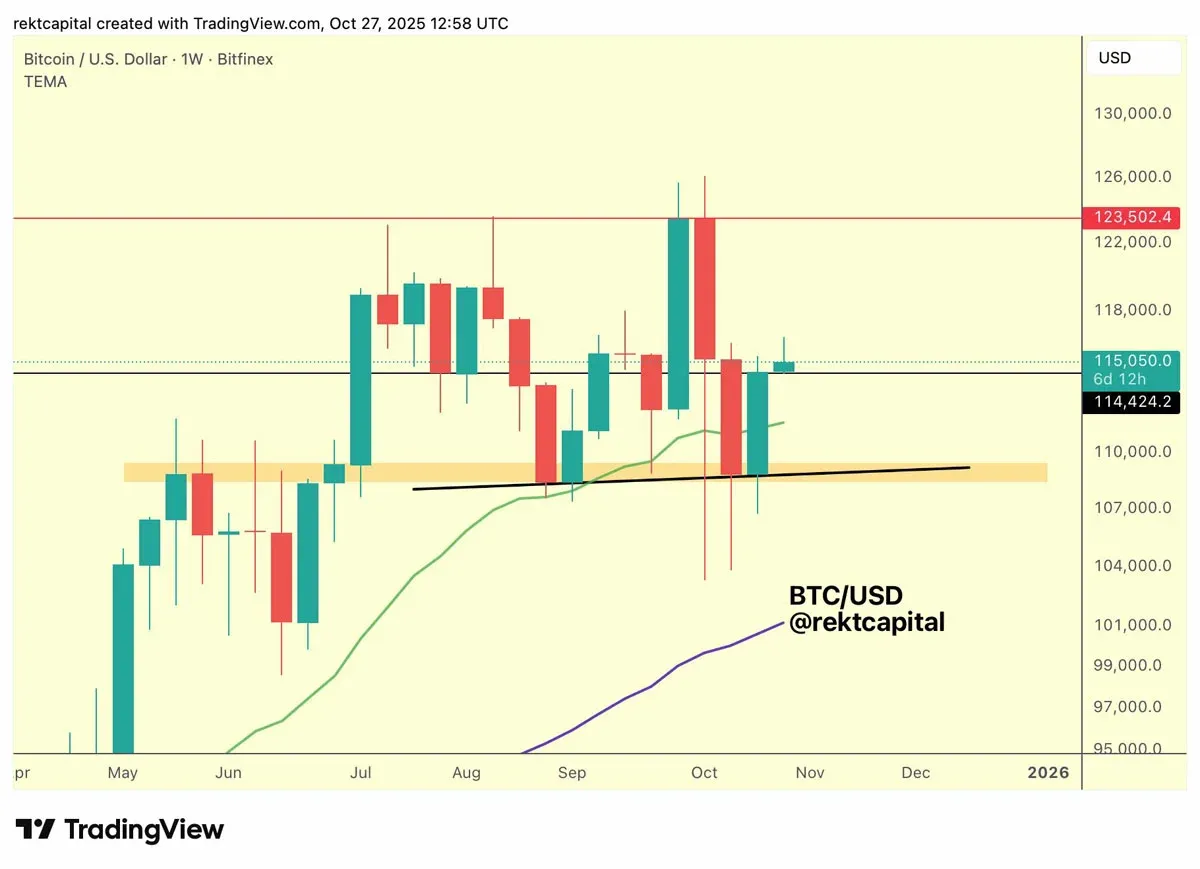
Bullish forces currently need to reclaim and stabilize above two core support levels. Renowned trader and analyst Rekt Capital pointed out that these two positions are:
- The 21-week Exponential Moving Average (EMA): Currently situated near $111,200.
- The Weekly Close Level: Specifically at $114,500.
Rekt Capital stated on the social platform X: "Bitcoin has successfully achieved a weekly close above the 21-week EMA (the green curve in the chart) and $114,500 (the black horizontal line). The retest currently underway is intended to confirm that these positions have flipped from resistance into support. By pulling back to $114,500 and further testing the EMA, Bitcoin will complete the confirmation process for its upward momentum."
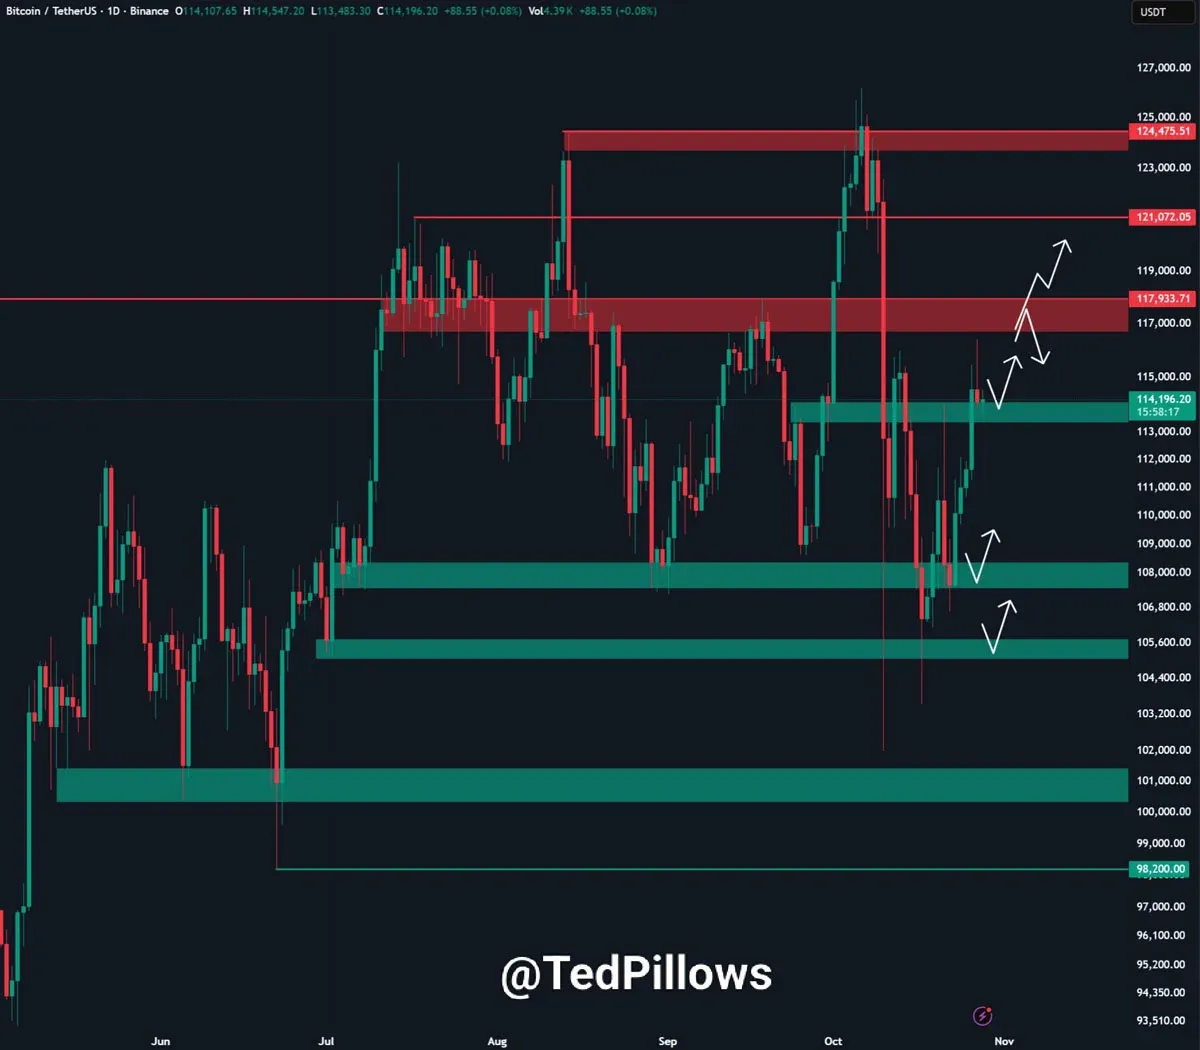
Crypto investor Ted Pillows holds a similar perspective, suggesting that Bitcoin has already bounced from the $113,500 support zone. As long as BTC can hold this position, the price median line will continue to shift upward; however, if this level is lost, it could lead to a further correction toward the $110,000 psychological milestone.
RSI Indicator Exhibits "Hidden Bullish Divergence"
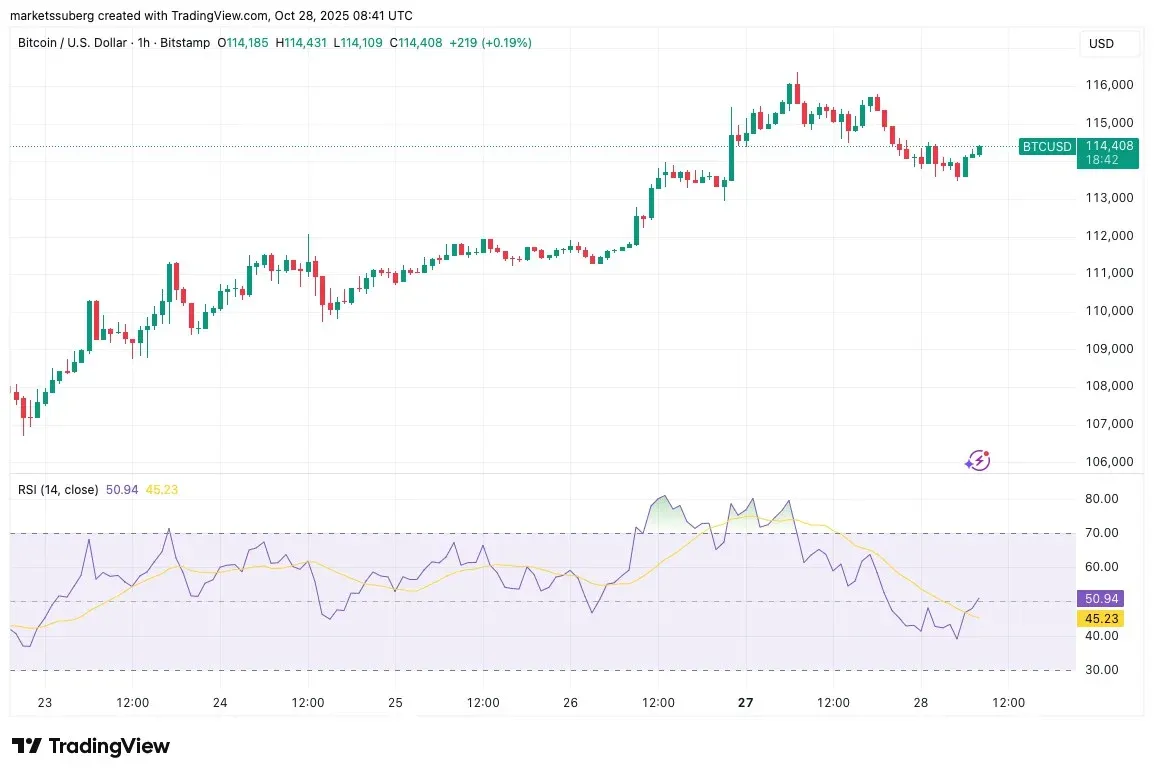
Technical indicators on lower timeframes are providing further reinforcement for the bullish camp. The hourly chart reveals that the RSI (Relative Strength Index) has developed a "hidden bullish divergence." This occurs when the RSI indicator hits a new low while the Bitcoin price manages to form a higher low. Such a divergence typically suggests that there is still room for the short-term upward trend to continue.
However, investors must remain cautious of signals from the high-cycle RSI. As mentioned in previous market reports, the RSI on daily and weekly levels has continued to print lower highs while the price has been breaking records. This "bearish divergence" phenomenon hints that the long-term trend may face the risk of momentum exhaustion.
Macro Sentiment Turns Cautious as Fed Meeting Approaches
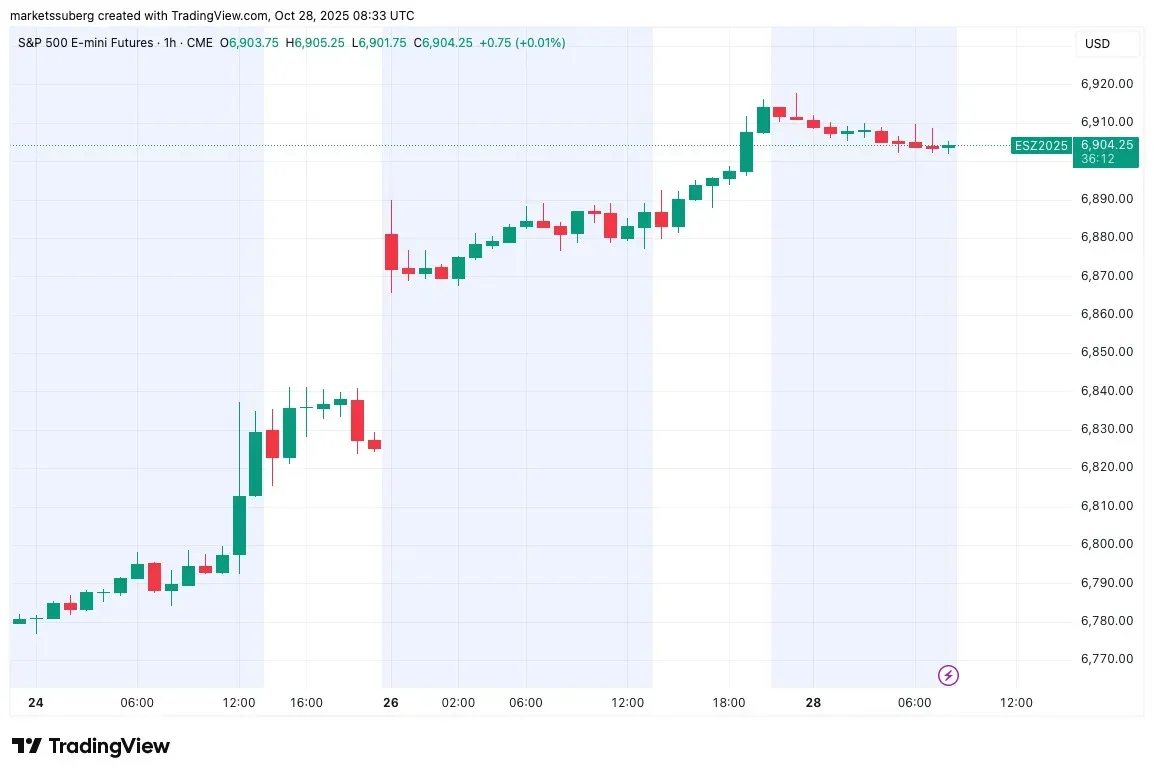
The rally in US stock index futures showed signs of a pause ahead of the Federal Reserve’s interest rate decision. As the most significant macroeconomic event of the week, the Fed's decision has a profound impact on risk assets. S&P 500 futures cooled slightly before the Wall Street opening bell, reflecting a sense of risk aversion in the market during the lead-up to the meeting.
Analyst Ted Pillows observed that Bitcoin often peaks on Mondays and forms a local low on Tuesdays, which provides a timely window for the retesting of support levels.
Despite the short-term volatility, institutions such as Mosaic Asset Company believe that the bull market logic for risk assets remains solid. In their latest newsletter, *The Market Mosley*, they noted:
- Earnings Expectations: Evidence of economic growth has bolstered corporate earnings expectations.
- Liquidity Environment: The prospect of the Federal Reserve cutting interest rates against a backdrop of a strong economy provides additional fuel for rallies in both the stock and crypto markets.
The above is a detailed interpretation of Bitcoin (BTC) price retesting the $111,000 support level and an analysis of RSI indicator momentum. For more in-depth data regarding BTC technical analysis and market trends, please continue to follow professional analysis channels. As a reminder, always ensure you are using compliant platforms like Binance.US if you are in the States, and consult with a professional regarding potential tax liabilities on your crypto gains.
Related Reading
- Bitcoin Mining Difficulty Drops 7.5% on June 29 – Biggest Cut Since 2021
- Bitcoin Scarcity: Supply, Halving Mechanism & Market Cap
- Binance Strategic Shift: Bitcoin Now Primary Emergency Reserve
💡 Register on Binance with referral code B2345 for the maximum trading fee discount. See Binance complete guide.



