
 Bitaigen Research
Bitcoin is battling for liquidity around the $80,000 level this week, with the key drivers being tariff shocks, support‑level tests, gold movements, U.S. macro data, and shifts in market structure.
In this report we outline the multiple factors that have pushed Bitcoin toward the critical $80,000 threshold, covering tariff impacts, gold linkage, macro data, and on‑chain structural changes. Through charts and on‑chain metrics we help readers quickly grasp the main risks and opportunities this week, and the following sections will dissect each point’s potential impact in more detail—worth a careful read.
Overview of Key Points
- Bitcoin slipped below $92,000, prompting traders to warn that deeper support levels may come under pressure again.
- The tariff dispute has reignited, and most expect market volatility to intensify until the risk‑asset bull market resumes.
- Gold and silver have simultaneously hit historic highs, leading some investors to anticipate that Bitcoin will follow their rally.
- The Federal Reserve’s rate‑cut narrative has faded from view, with related U.S. macro data slated for release soon.
- On‑chain metrics indicate that Bitcoin has already laid a structural foundation for a sustainable upward move.
Bitcoin Price Action: Volatility Is Inevitable
After the U.S. futures market opened, Bitcoin saw a sharp drop—exactly the move many analysts predicted based on the current tariff‑negotiation outlook.
- Multiple trade disputes in 2025 caused a broad sell‑off in risk assets.
- According to TradingView data, BTC/USD briefly fell through $92,000 before rallying back.
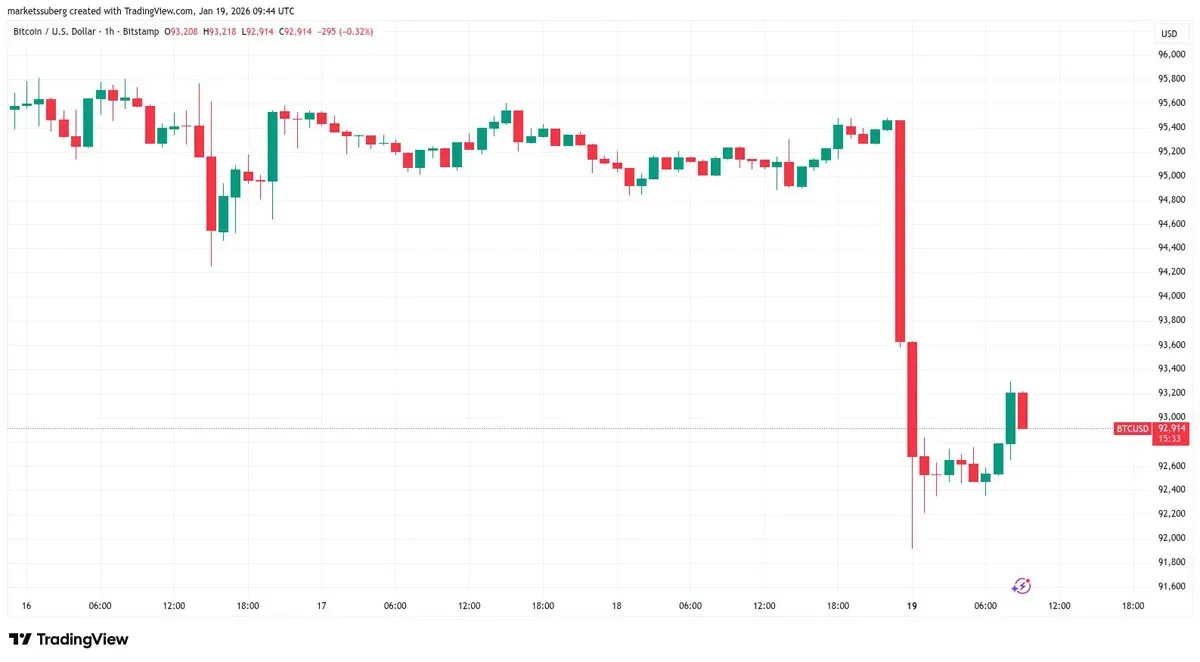
BTC/USD 1‑hour chart. Source: Cointelegraph/TradingView
Trader CrypNuevo wrote on X: “Brace for extreme volatility this week!” He believes that, with the U.S. Martin Luther King Jr. holiday, equity‑market reactions will be delayed until Tuesday.
“Markets dislike uncertainty, but they love its disappearance. Therefore, I lean toward the view that some downside pressure will pull price back into the range, possibly touching the lower bound, before a genuine reversal can occur.”
Key Support Levels
- Approx. $87,000 – projected opening price for the full‑year 2026
- Range low $80,500
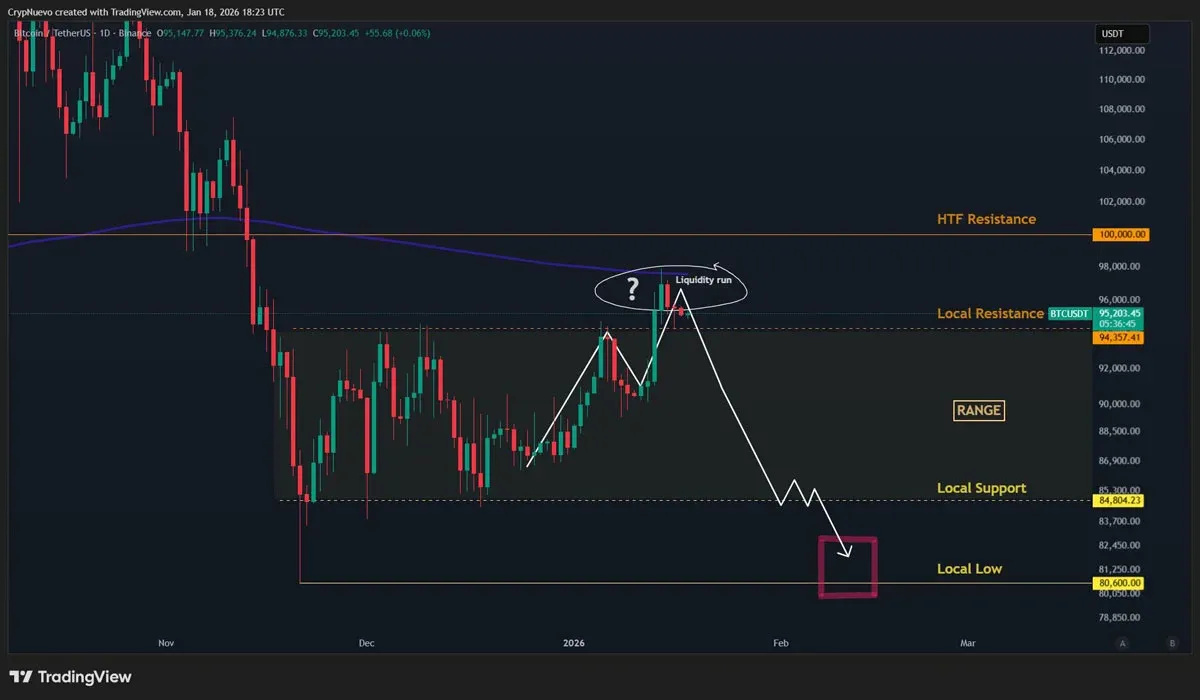
BTC/USDT daily chart. Source: CrypNuevo/X
Order‑book data shows an acceleration of long‑position liquidations below the yearly opening price, raising the risk of liquidity outflows.
“Taking the above factors together, the most likely scenario is that equities enter a sideways correction, Bitcoin retreats into the range and trades near the lower bound over the next few weeks.” — CrypNuevo
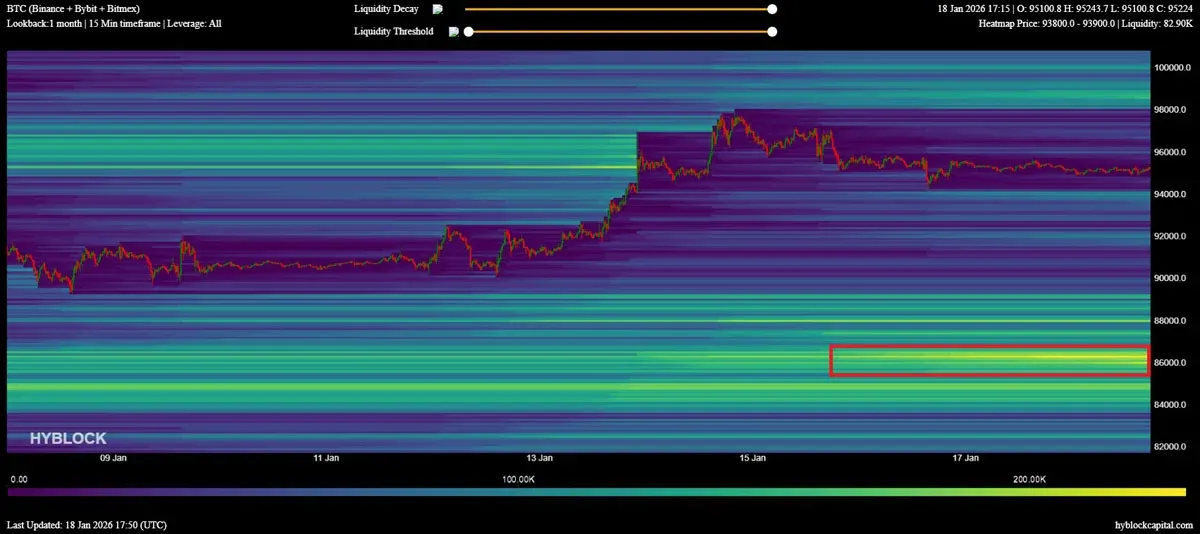
Bitcoin order‑book liquidity data. Source: CrypNuevo/X
Trader Daan Crypto Trades again warns that the previously critical breakout level—the 2025 full‑year opening price of $93,500—has been breached.
“In the traditional‑finance market’s reaction to the new weekend tariffs, Bitcoin fell straight from the futures opening price. The current price finds support on the 200‑day moving average on the 4‑hour chart, but the breakout level has been broken.”
“After two months of consolidation, longs must defend this breakout. If price slides below $93,000–$94,000, it would merely be a liquidity‑grab move within a larger downtrend.”
Tariff Shock Fuels a Week of Turbulence
Tensions between the U.S. and Europe over the Greenland issue have revived the tariff war as a focal point for risk‑asset traders.
- After futures opened on Sunday night, the market immediately wavered; even though Wall Street was closed on Monday for the holiday, the impact lingered.
- The United States plans to levy tariffs of up to 25 % on Denmark, Norway, Sweden, France, Germany, the United Kingdom, the Netherlands, and Finland starting February 1.
Cointelegraph reported that throughout 2025, both crypto and equities were highly sensitive to tariff news. In April 2025, after former President Trump enacted a “tariff liberation day,” Bitcoin plunged below $75,000, setting a new low.
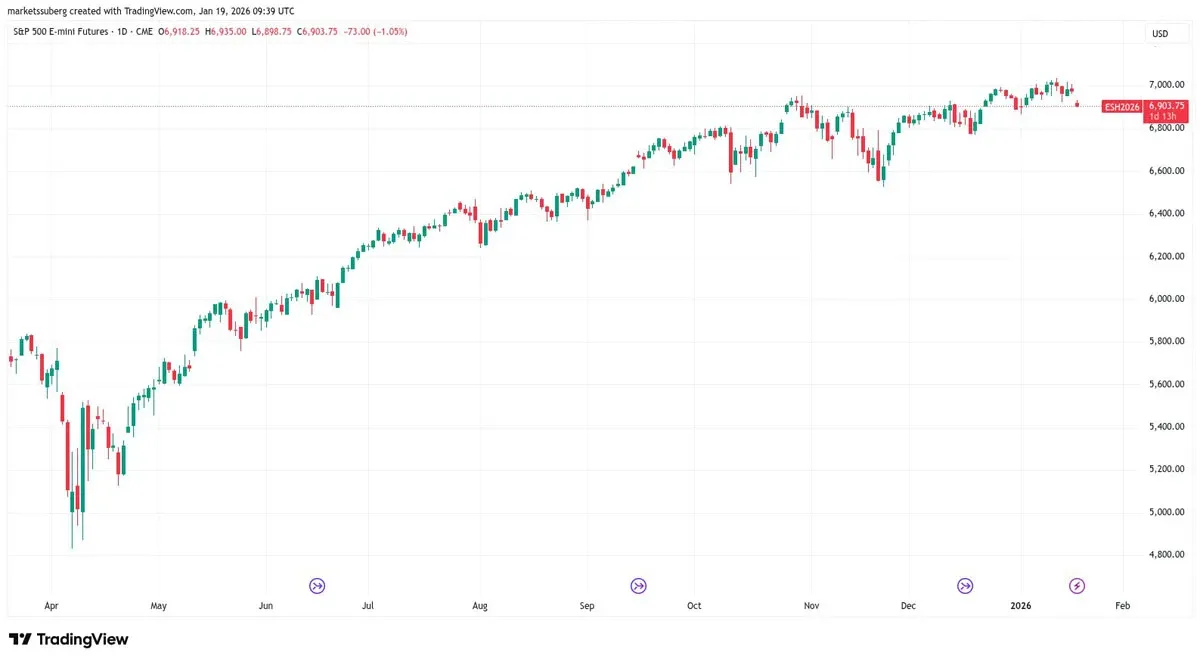
S&P 500 futures daily chart. Source: Cointelegraph/TradingView
The trading resource “Kobesey Letter” notes that Trump’s “tariff playbook” follows a fixed pattern of trade pressure, and each market‑sentiment sell‑off exhibits similar characteristics.
“Market sentiment may trigger short‑term sell‑offs, but because there is time to digest the shock, the magnitude could be limited.”
The manual outlines twelve stages spanning several weeks, during which markets will experience multiple periods of weakness before ultimately favoring risk assets again.
Precious Metals Reach New Peaks
Even as risk assets stay subdued, gold and silver have benefited from the prevailing turmoil.
- Early this week, gold edged close to $5,000 per ounce for the first time.
- Silver hit a historic high of $94 per ounce.
“Gold is still telling the story of the future.” — Kobesey
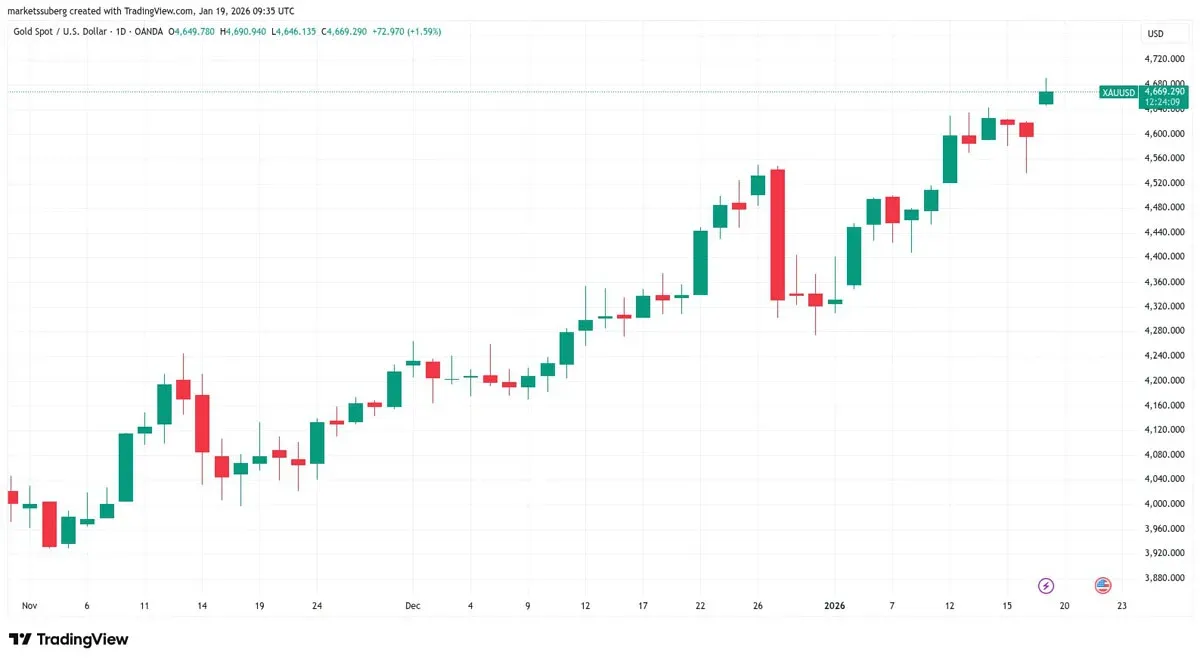
XAU/USD daily chart. Source: Cointelegraph/TradingView
Compared with Bitcoin, gold remains slightly below its two‑year peak, but since August 2025, gold priced in BTC has almost doubled.
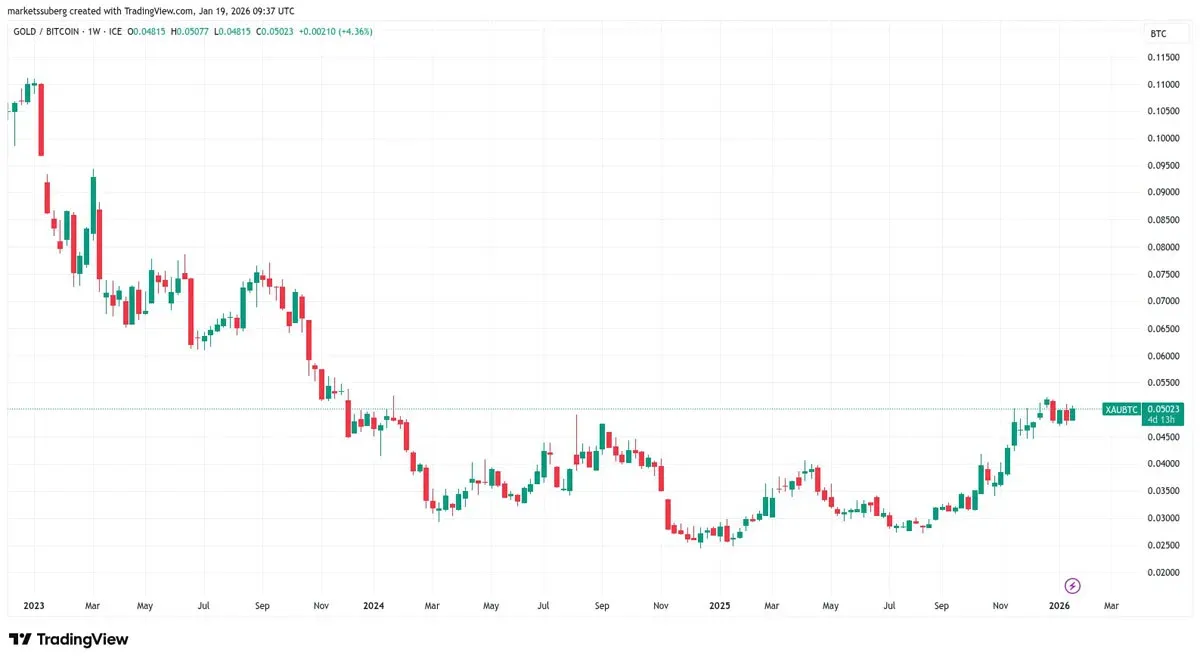
XAU/BTC weekly chart. Source: Cointelegraph/TradingView
Network economist Timothy Petersen believes that Bitcoin still has the potential to chase the historical trajectory of gold.
“The trend lines of Bitcoin and gold almost coincide; both are moving in the same direction, merely taking different paths.”
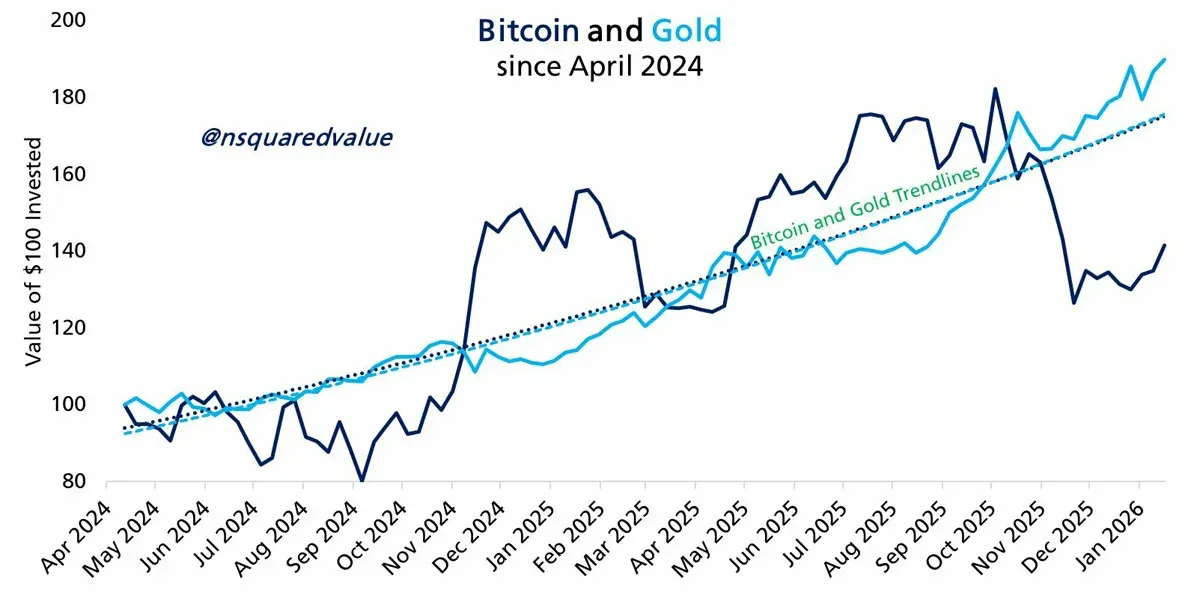
Bitcoin vs. gold price chart. Source: Timothy Petersen/X
Petersen further predicts that gold could enjoy at least a five‑year bull market, and equities are also likely to maintain a long‑term uptrend.
Federal Reserve Rate Decision and Mixed Inflation Signals
This week U.S. macro data will be released in the form of the Fed’s “preferred” inflation indicator.
- The November Personal Consumption Expenditures (PCE) index will be published on Thursday, alongside the initial unemployment claims and the third‑quarter GDP preliminary revision.
- Even without a tariff catalyst, the macro environment itself is contradictory: equities are strong, yet the Fed and government financial policies face unprecedented tension; geopolitical uncertainty in the Middle East is also escalating.
Mosaic Asset noted in its latest briefing that despite investors closely watching tariff‑related and geopolitical volatility, the market remains broadly bullish in the short term.
“Commodities are breaking out, a trend that is expected to have a significant impact on inflation outlooks.”
Cointelegraph reported a divergence between November CPI and PPI trends. The market broadly expects the Fed to hold rates steady at the January meeting, which offers limited liquidity support for crypto and other risk assets.
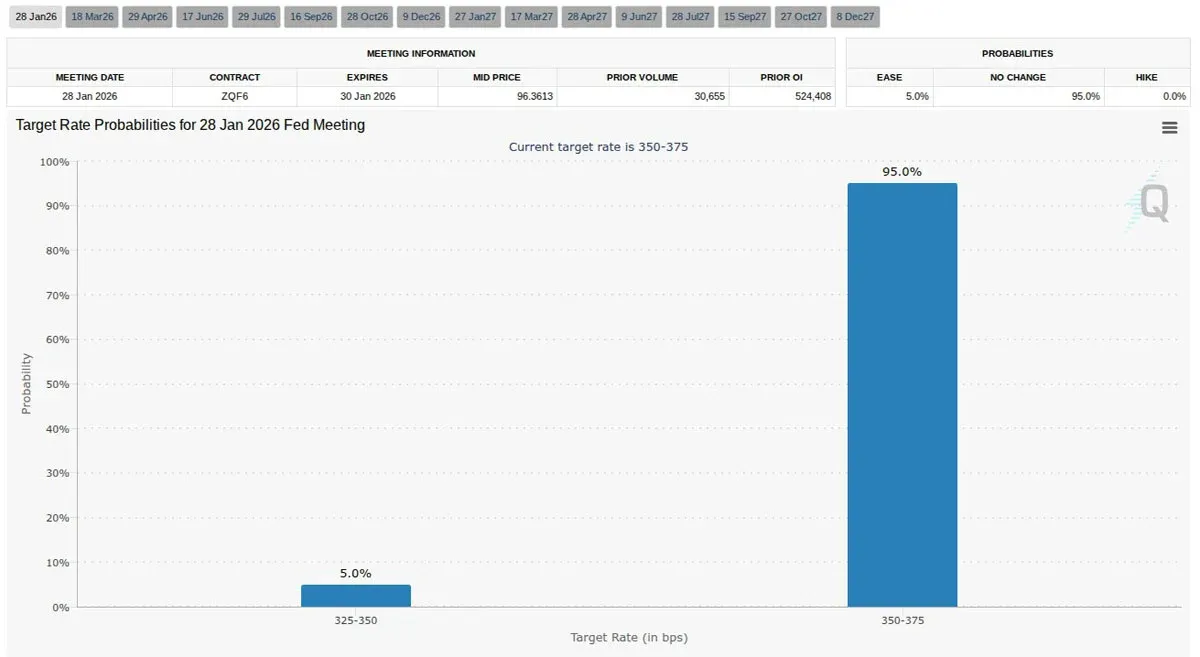
Fed January FOMC target rate probability chart. Source: CME Group FedWatch Tool
Bitcoin Market Structure Moving Toward Health
On‑chain analytics platform CryptoQuant states that as price approached $98,000 last week, buyers are steadily regaining control of the market.
“The recent bounce is not a levered futures rally but a genuine recovery of spot‑market buying demand.” — COINDREAM
CVD (Cumulative Volume Delta) data shows spot CVD shifting from seller dominance to buyer dominance, with futures CVD following suit, indicating an early stage of demand recovery.
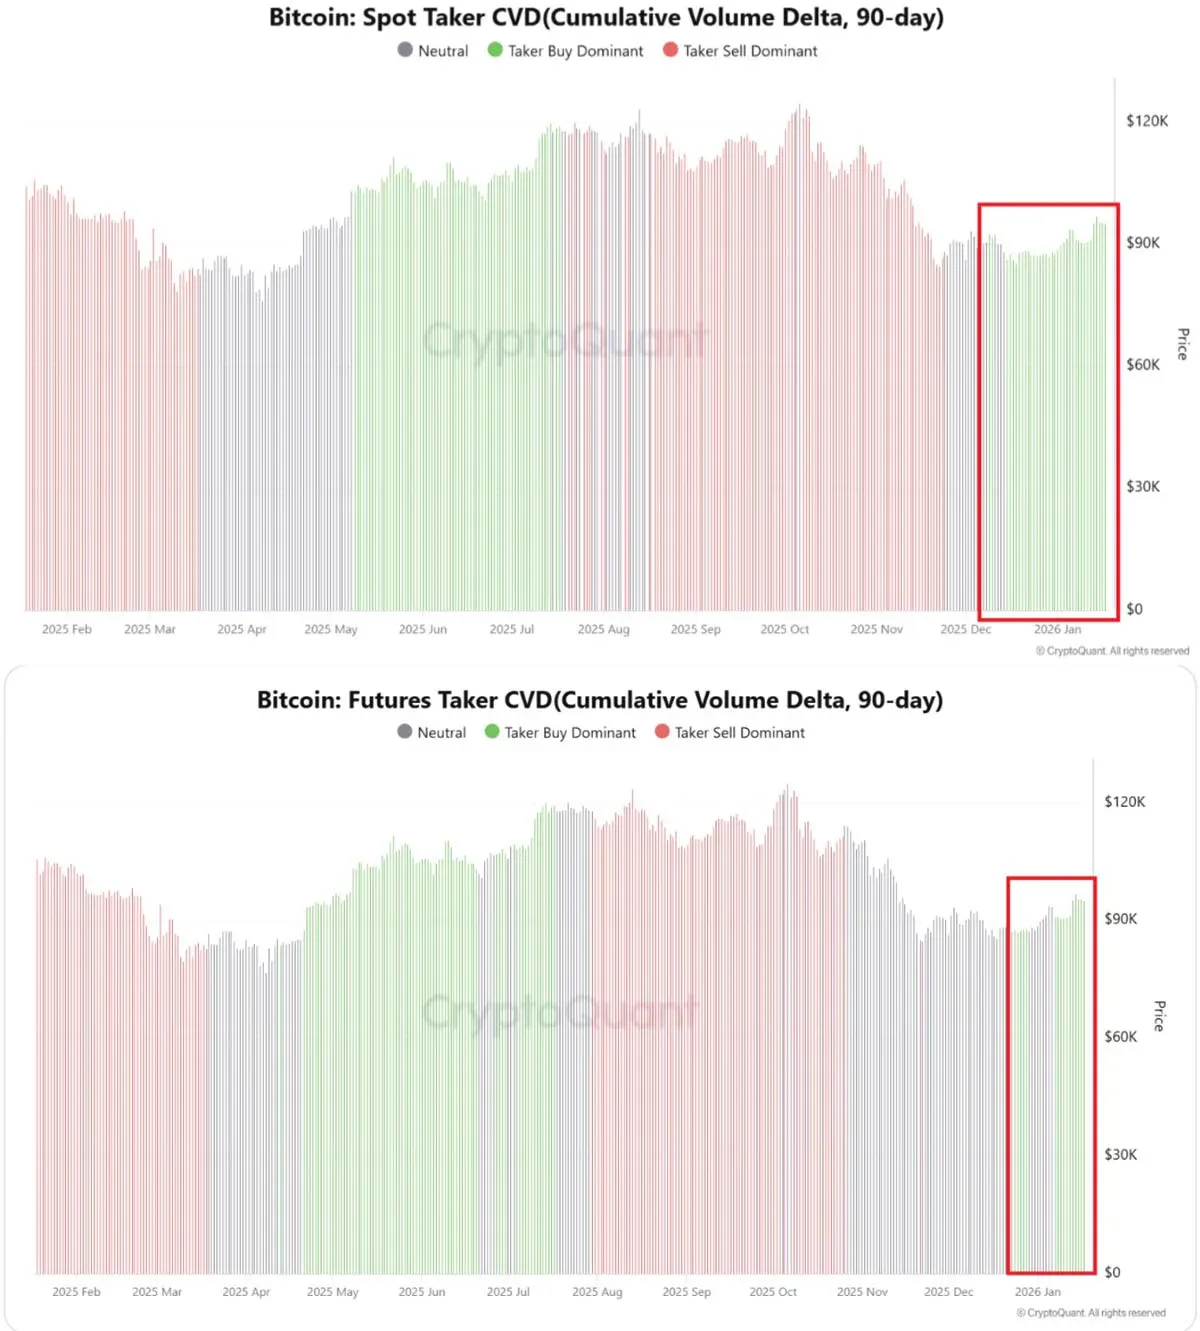
Bitcoin CVD data screenshot. Source: CryptoQuant
In addition, open interest (OI) for derivatives priced in Bitcoin has fallen roughly 17.5 % from its peak.
“The gradual decline in open interest suggests that risk appetite is slowly returning.” — Darkfost
If this trend persists and strengthens, it could further underpin bullish momentum, although the current rebound remains relatively modest.
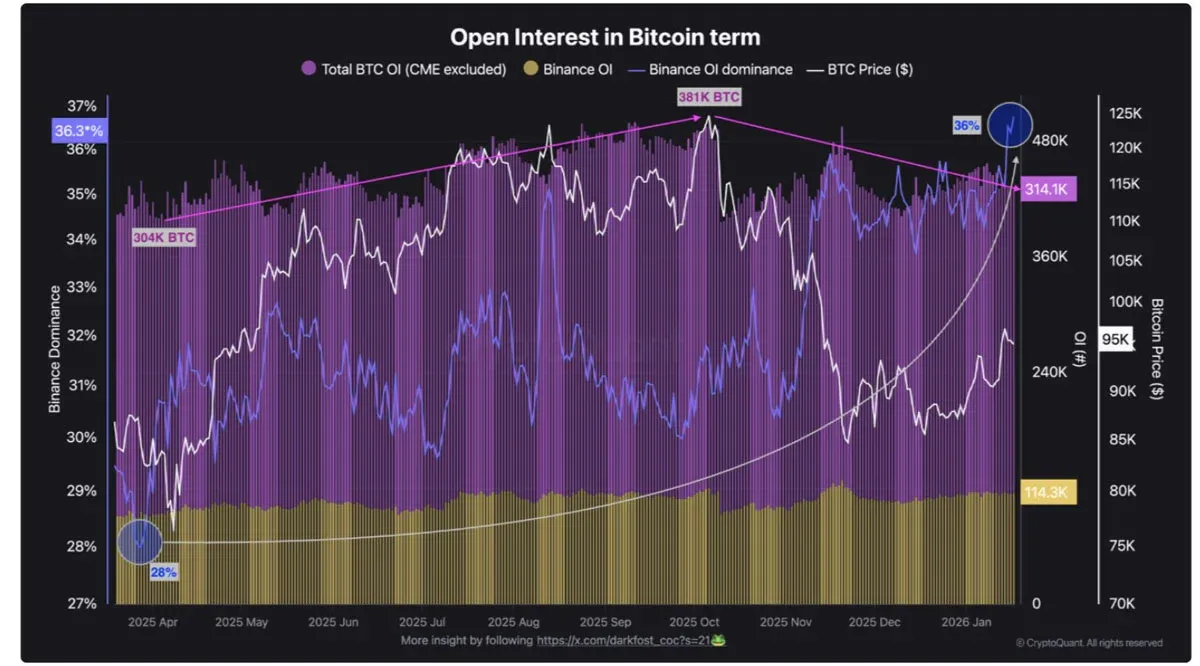
Bitcoin open‑interest data screenshot. Source: CryptoQuant
That concludes the full analysis titled “Bitcoin’s New $80 k ‘Liquidity Grab’: 5 Things BTC Traders Need to Know This Week.” For more on Bitcoin’s recent price action and liquidity considerations, follow additional articles from Bitaigen.
*Note: U.S. residents should use Binance.US for trading, not the global Binance platform. Crypto gains may be taxable in your jurisdiction; consult a tax professional for guidance.*
Related Reading
- Bitcoin Sentiment to $150k Fades, Market Stabilizes
- Bitcoin Trade: 1× Leverage, 1.07% Loss, Resistance Confirmed
- Bitcoin Rebound Faces Liquidity Crunch: Will the Rally Hold?
💡 Register on Binance with referral code B2345 for the maximum trading fee discount. See Binance complete guide.



