
 Bitaigen Research
 Summary
- Short‑term execution: Last week we strictly followed the pre‑determined trading plan, completing a short‑term trade with 1× leverage that resulted in a net loss of 1.07 % (see Figure 1).
- Core hypothesis validation: Our prior forecast that the key resistance zone would lie between $94,500 – $95,000 was confirmed by the market; the price peaked at $97,963, just 0.5 % below the preset upper band of $97,500, further corroborating our assessment of the critical level.
- Outlook: Will Bitcoin turn the corner from a bear market to a bull market? The 21‑week moving average could become the dividing line between bullish and bearish momentum; see Figure 4 for the subsequent price‑action analysis.
The following sections systematically review last week’s market dynamics, strategy execution, and this week’s operational ideas.

In this article we provide a systematic recap of Bitcoin’s price action and trade execution over the past week, with a detailed dissection of how the key resistance level was validated. By comparing the structures of two historical weekly corrections, we extract possible pivot signals to help readers capture short‑term bear‑to‑bull transition opportunities. The forthcoming charts and forward‑looking analysis are intended to serve as reference material for your decision‑making process.
5. Will History Repeat Itself? A Comparison of Two Weekly Corrections and the Lessons Learned

By juxtaposing the weekly structures from November 2021 and October 2025, three key conclusions emerge:
- The current weekly chart remains in a bearish configuration, limiting the amplitude of any daily‑level rebound.
- If Bitcoin fails to hold the 21‑week moving average (around $10,200) over the coming weeks, the market could replicate the historical pull‑back and potentially dip below $80,000.
- The appearance of a stabilising signal in the weekly MACD and a successful crossing of the zero‑line by the momentum line will be pivotal in determining whether a trend reversal is underway.
4. This Week’s Trading Strategy (Excluding Unexpected News) (01‑19 – 01‑25)
- Mid‑term perspective: Maintain a flat (no‑position) stance and watch for possible range‑bound movement.
- Short‑term perspective: Allocate 30 % of capital, set stop‑losses based on support/resistance zones, and focus on the $94,500 – $95,000 range using a 30‑minute operational timeframe.
To accommodate divergent market directions, two contingency plans have been prepared:
- Plan A (if the price holds above $94,500 – $95,000)
- Entry: Open a 30 % long position when the price breaks the zone, shows a stabilising signal, and the model issues a bottom‑alert.
- Risk control: Place the stop‑loss 1.5 % below the entry price (0.985 × entry).
- Exit: Gradually take profit when the price climbs back to the core resistance level and the model confirms the move.
- Plan B (if the price falls through $94,500 – $95,000)
- Entry: Open a 30 % short position after a confirmed break below the zone.
- Risk control: Set the stop‑loss 1.5 % above the entry price (1.015 × entry).
- Exit: Scale out when the price approaches $86,500 and the model signals a bottom.
3. Market Forecast for the Week (01‑19 – 01‑25)
The primary focus is the behaviour of the $94,500 – $95,000 band:
- If pressured: Should the price encounter resistance within this band, we expect it to continue oscillating between $84,000 – $94,500, with the first support target around $89,500 – $91,000.
- If it holds: A firm hold above the band limits upward upside, yet modest rebounds within the range remain plausible.
Key resistance and support levels are outlined below:
- Resistance
- First resistance: $94,500 – $95,000 (upper edge of the box)
- Second resistance: $97,500 – $99,500 (previous consolidation centre)
- Critical resistance: $10,200 (near the 21‑week moving average)
- Support
- First support: $89,500 – $91,000 (dense chip concentration)
- Second support: $86,000 – $86,500 (historically important support)
- Critical support: $84,000 (lower edge of the box)
2. Technical Perspective on Bitcoin’s Structural Dynamics — Multi‑Model Integrated Assessment
By combining our proprietary momentum, sentiment, and numeric‑monitoring models, we perform a multidimensional analysis of Bitcoin’s weekly and daily structures.
Weekly View
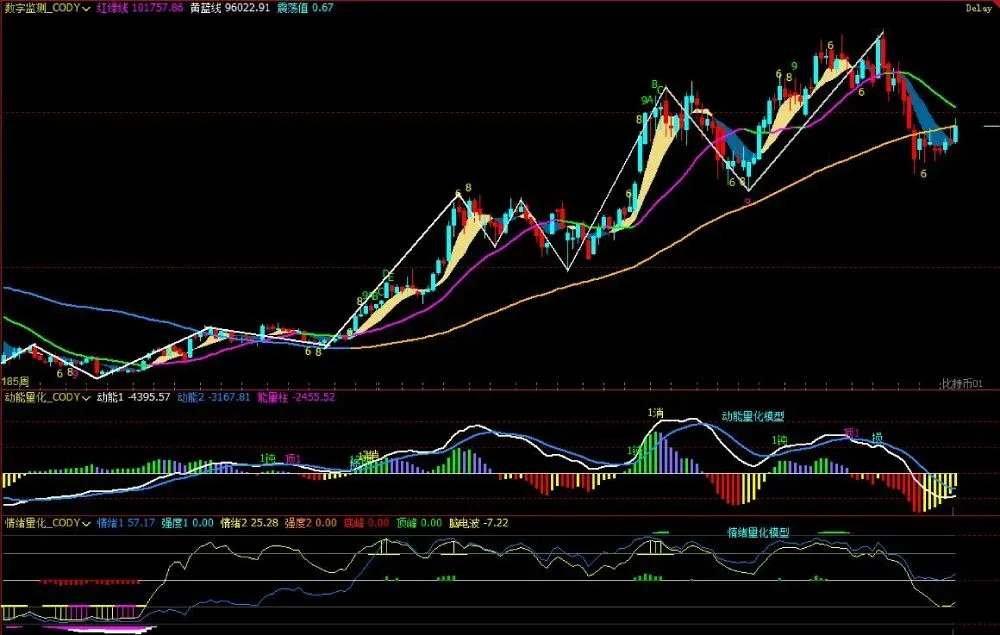
*Figure 2*
- Momentum model: The momentum line is gravitating toward the zero‑axis, while the negative‑energy bars are progressively narrowing, indicating that a clear reversal signal for the bearish trend has not yet materialised.
- Sentiment model: The blue‑line sentiment score sits at 57.17, the yellow‑line at 25.28, both reflecting zero intensity, which suggests a neutral pressure/support index.
- Numeric monitoring: The price has been trading below the bullish‑bearish demarcation line (yellow‑blue line) for nine weeks; last week’s bullish attempt failed, and the close remained beneath the line.
Overall, the weekly chart retains a bearish bias, and traders should remain wary of potential range‑bound corrections.
Daily View
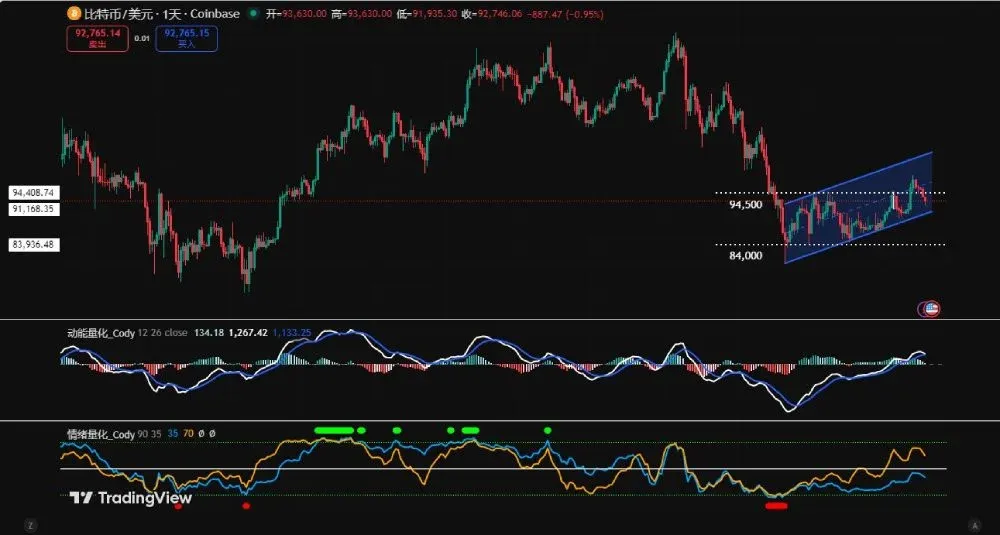
*Figure 3*
- Momentum model: During the first half of the week the momentum line rose above the zero‑axis and expanded rapidly, later displaying a “rise‑then‑suppression” pattern; the momentum bars contracted and the line fell back toward zero, signalling waning bullish thrust.
- Sentiment model: After the daily close, the blue line registered 38 and the yellow line 76, both still at zero intensity, indicating a neutral pressure/support stance.
Conclusion: Although the daily chart showed a brief rally, its durability remains unproven, and future price action will hinge on the contest for the zero‑axis.
1. Bitcoin’s Weekly Recap (01‑12 – 01‑18)
1. Short‑Term Trade Overview
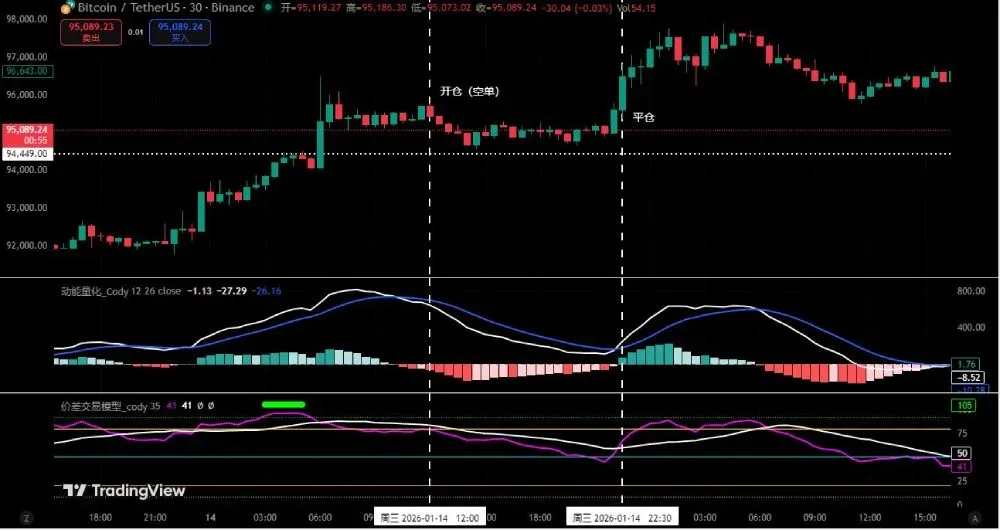
*Figure 1*
Relying on our in‑house price‑spread trading model and momentum‑quantitative model, we executed a 1× leveraged short‑term trade that ultimately resulted in a ‑1.07 % loss.
Trade details (pre‑leverage)

Post‑trade review
Our first operation adhered to Plan A (short at resistance): When the price hit the critical resistance band of $94,500 – $95,000 and a resistance signal emerged, the price‑spread model simultaneously issued a top‑alert (green dot), providing double confirmation. Consequently, we entered a 30 % short at $95,460. The price then found support near $94,500 and rebounded. The momentum and price‑spread models subsequently generated a bottom signal, prompting an immediate stop‑loss exit at $96,493. Although the trade ended in a loss, we strictly observed the “signal‑driven entry, risk‑first” discipline.
2. Anticipated Weekly Movement and Corresponding Tactics
- Range assessment: We expected Bitcoin to oscillate within $84,000 – $94,500, paying close attention to directional bias at either end of the band.
- Key levels: Primary resistance at $94,500 – $95,000, secondary resistance at $97,500 – $99,500, and support around $89,500 – $91,000.
- Mid‑term outlook: Should the price break and firmly settle above $94,500, we would liquidate all short positions and shift to a neutral stance.
- Short‑term execution (Plan A):
- Entry: Open a 30 % short when resistance materialises in the $94,500 – $95,000 zone and the model signals a top.
- Stop‑loss: Place it 1.5 % above the entry price (1.015 × entry).
- Exit: Gradually take profit once the price retreats to core support and the model confirms the move.
6. Special Operational Notes
- Set a stop‑loss as soon as the position is opened.
- When profit reaches 1 %, move the stop‑loss up to the breakeven price to protect capital.
- When profit reaches 2 %, shift the stop‑loss to lock in 1 % of the realised gains.
- Thereafter, for every additional 1 % of profit, lift the stop‑loss by 1 %, achieving a dynamic breakeven mechanism.
Disclaimer: The models, viewpoints, and trading ideas presented herein are the author’s own technical analyses and are intended solely as a record of trading activity. They do not constitute investment advice. Financial markets are highly volatile; participants must make their own judgments and bear all associated risks (DYOR). *Please note that cryptocurrency gains may be subject to taxation in your jurisdiction, and appropriate reporting should be undertaken.*
---
This concludes the full translation of “Bitcoin Weekly Market Analysis: Short‑Term Bear‑to‑Bull Transition – Will History Replay?” For additional Bitcoin‑related insights, you may search the archives of Bitaigen or continue reading the recommended articles below. Wishing you successful trading and thank you for your continued attention!
Related Reading
- Bitcoin Rebound Faces Liquidity Crunch: Will the Rally Hold?
- Federal Reserve Liquidity Injection Set to Boost Bitcoin in 2026
- Bitcoin & Ethereum Falter in Final Crypto Deleveraging Phase
💡 Register on Binance with referral code B2345 for the maximum trading fee discount. See Binance complete guide.



