
 Bitaigen Research
 Early 2026 Bitcoin Technical Overview
At the start of 2026, Bitcoin’s on‑chain technical picture shows a range‑bound pattern. Seller pressure has eased, yet upward supply remains, keeping the price stalled around $98,000. Short‑term holders are sitting near their cost basis, creating modest sell pressure, and overall market participation stays low.

Key Takeaways
- On‑chain structure remains fragile: price hovers near a critical cost‑basis level and lacks a sustained vote of confidence from long‑term holders.
- Supply surplus persists: investors who bought recently face resistance from the supply ceiling above, limiting the durability of any upside and making rebounds prone to sell‑offs.
- Spot‑market capital flows are turning mildly positive: major exchanges show a slight easing of seller pressure, but buying is selective rather than a broad‑scale rally.
- Institutional treasury flows are sporadic: treasury activity appears event‑driven and fragmented, without a coordinated buying trend, so its impact on overall demand is limited.
- Derivatives market participation is low: futures volume has contracted and leverage use is cautious, indicating a market with weak involvement.
- Options market feels only short‑term strain: implied volatility for the near term reacts to risk events, while medium‑ and long‑term volatility remains stable.
- Hedging demand warmed briefly before returning to normal: the surge in put‑to‑call volume ratios has subsided, suggesting risk avoidance was tactical.
- Dealer gamma exposure is net short: this weakens the mechanical support that would otherwise help price stability and raises sensitivity to liquidity shocks.
In this article we walk through a full‑picture technical scan of Bitcoin at the beginning of 2026, dissecting on‑chain structure, supply pressure, capital flows, and derivatives activity layer by layer. Our aim is to help market participants detect subtle signals, clarify the current risk‑reward balance, and keep a clear view amid volatility. The Bitaigen editorial team leverages data models and on‑chain monitoring to deliver a deep‑dive analysis for anyone navigating this turbulent environment.
Note: All fiat references are expressed in USD. International transfers typically use SEPA (for Euro‑zone) or SWIFT networks. U.S. residents should access spot markets through Binance.US rather than the global Binance platform. Crypto gains may be taxable in your local jurisdiction; consult a tax professional for guidance.
On‑Chain Depth Analysis
Over the past two weeks, the anticipated technical rebound largely materialized, only to stall once price hit resistance and fell back beneath the short‑term holders’ cost basis. This reaffirmed the presence of tangible sell pressure above the current level. The present report focuses on the structure and behavior of this “floating‑cap” supply, exposing emerging seller dynamics.
Technical Rebound Meets Resistance
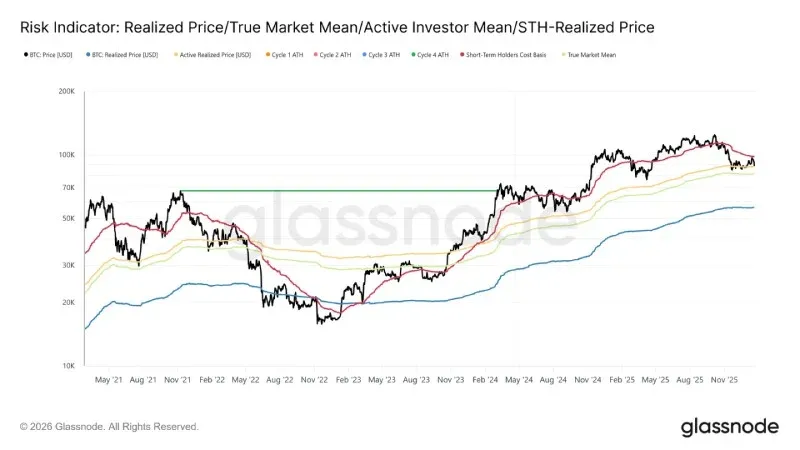
The market continues to linger in a gentle bear phase. The lower boundary of the downtrend is supported by a real‑market average of $81,100, while the upper boundary is capped by the average cost of short‑term holders. This corridor forms a fragile equilibrium: downward pressure is being absorbed, yet upward attempts repeatedly encounter sellers who entered between Q1 and Q3 of 2025.
Entering early January 2026, a softening of seller strength opened a window for price to bounce toward the top of the range. However, as price approached the $98,000 region, investors who bought recently showed an increasing willingness to sell near their cost, amplifying the risk of the rebound.
Recent price action stalled near $98,400—the short‑term holders’ cost line—mirroring the market structure seen in Q1 2022. Back then, the market repeatedly failed to break through the cost zone of recent buyers, extending the consolidation period. This similarity highlights the delicate nature of the current recovery attempt.
“Floating‑Cap” Supply Pressure Remains
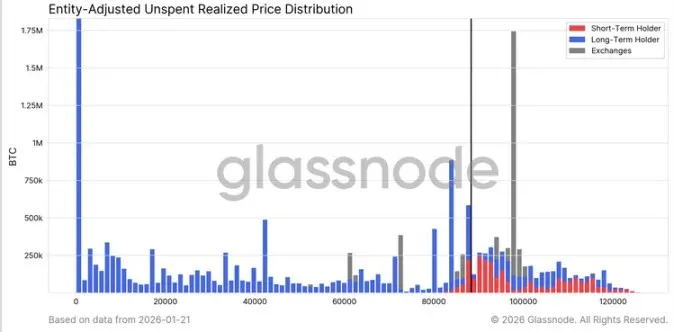
Observing that price is blocked at a key cost level, we turn to the on‑chain supply distribution for a clearer explanation of why upward momentum keeps getting knocked back.
- The URPD (Unrealized Profit/Loss Distribution) chart shows that excess supply above $98,000 continues to be the primary drag on short‑ to medium‑term rebounds.
- The recent bounce filled a “vacuum” between roughly $93,000 and $98,000, creating a new cluster of short‑term holders as early buyers transferred to newcomers.
- Above $100,000, a broad and dense supply zone has emerged, gradually being taken over by long‑term holders. Unsold “floating‑cap” coins will keep exerting sell pressure, likely keeping price pinned below the $98,400 cost line and the psychological $100,000 threshold. A decisive break would require a strong, accelerating demand surge.
Long‑Term Holders Also Pose Resistance
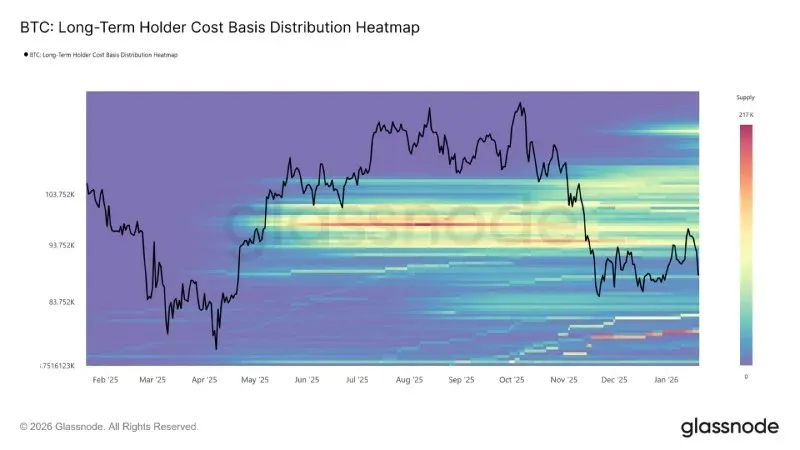
Expanding the lens from short‑term holders to long‑term positions reveals the same structural constraints.
- A heat‑map of long‑term holder cost bases shows a dense concentration of cost levels above the current spot price.
- When price climbs into these historic purchase zones, the area represents a massive pool of potential sell‑side liquidity.
Until demand is strong enough to absorb the supply sitting above, long‑term holders will remain a latent source of resistance. Without fully digesting the “floating‑cap” supply, upward room may stay limited, and any bounce could quickly meet fresh sell pressure.
Rebound Encounters Profit‑Taking and Stop‑Loss Selling
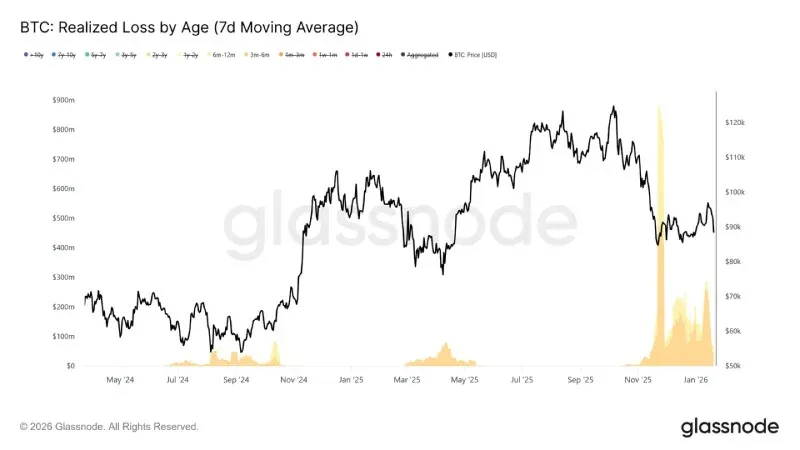
When we break down realized loss data by holding period, the bulk of loss‑driven sells come from the 3‑to‑6‑month cohort, followed by the 6‑to‑12‑month group. This pattern matches the classic “pain‑sell” scenario, especially prevalent among investors who bought above $110,000 and now sit near their cost line.
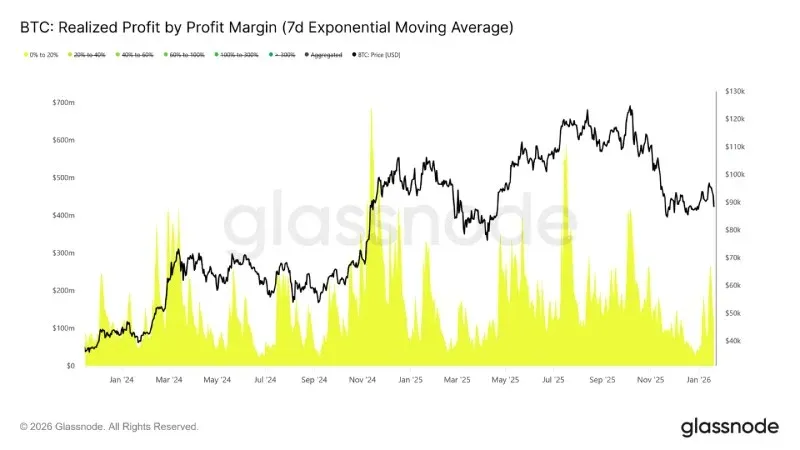
Conversely, realized profit data by percentage shows a marked rise in profit‑taking within the 0 %‑20 % profit band. Break‑even sellers and short‑term swing traders tend to exit with modest gains rather than waiting for a sustained trend. The increase in low‑profit sell orders continuously erodes upward momentum because supply is repeatedly released near cost levels.
Off‑Chain Market Observations
Spot Capital Flows Turn Mildly Positive
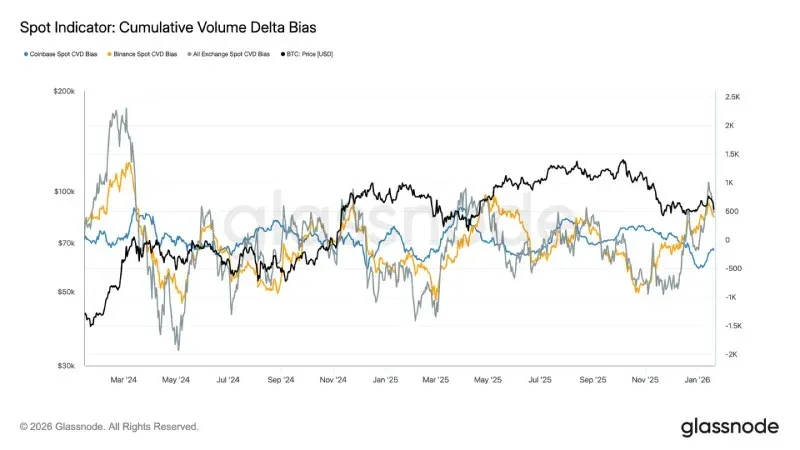
Spot‑market behavior has improved modestly after the recent dip. The Cumulative Volume Delta (CVD) metric on Binance and other major exchanges has flipped back into net‑buy territory, indicating that spot participants are beginning to re‑accumulate tokens rather than sell on rallies.
The net‑sell rate on Coinbase has also slowed dramatically, easing downward pressure and helping to trim the supply ceiling that was pushing price down. Although spot activity has not yet entered a phase of aggressive, trend‑following buying, the shift of major platforms back to net‑buy signals a positive adjustment in the underlying market structure.
Important for U.S. traders: Binance.US reflects the same CVD dynamics for its U.S.‑focused order book, but the platform’s data may differ slightly from the global Binance feed.
Digital‑Asset Treasury Inflows Remain Sporadic
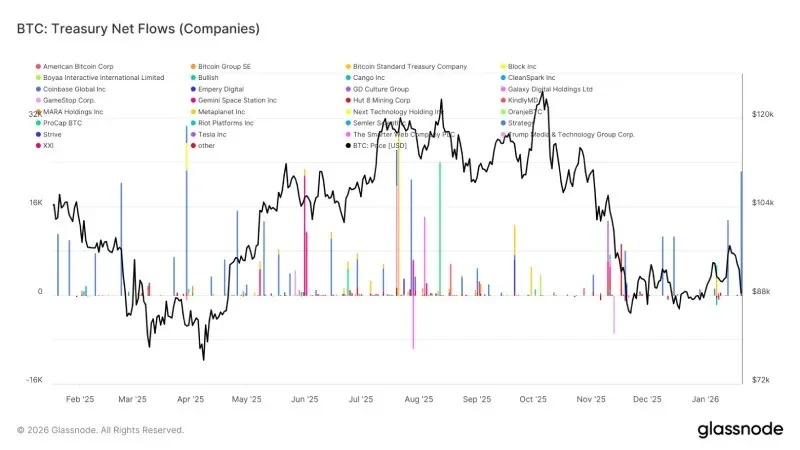
Net capital inflows into corporate and institutional crypto treasuries continue to appear fragmented and uneven. Activity is largely driven by isolated events rather than a broad, trend‑aligned buying wave. While a few firms have posted noticeable purchase spikes over the past weeks, overall enterprise demand has not settled into a sustained accumulation pattern.
In aggregate, treasury flows hover near the zero‑line with only narrow oscillations, suggesting that most corporate treasuries are in a watch‑and‑wait mode or are executing opportunistic trades instead of systematic position‑building. This contrasts sharply with earlier periods when multiple institutions coordinated purchases, accelerating price trends. Recent data indicates that corporate treasury demand is now peripheral and selective, exerting only intermittent influence on price dynamics.
Derivatives Market Is Thin
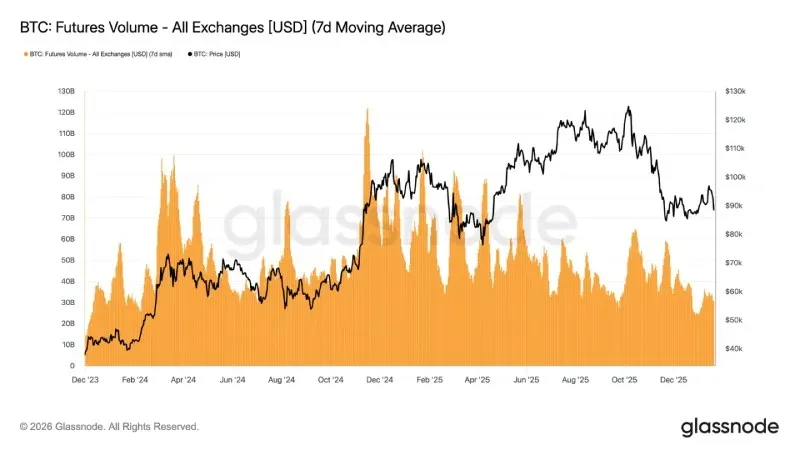
- Bitcoin futures 7‑day moving‑average volume continues to shrink, staying far below levels typical of trending markets.
- Recent price swings have not been accompanied by a proportional rise in trading volume, underscoring a low‑participation, low‑confidence derivatives environment.
- Adjustments to open‑interest have occurred without matching volume spikes, reflecting primarily rebalancing of existing positions rather than fresh leveraged inflows.
Overall, the derivatives arena is in a “quiet‑market” state, with scant speculative appetite. Such “ghost‑market” characteristics mean that any future uptick in volume could provoke outsized price reactions, but at present the impact on price discovery remains muted.
Implied Volatility Spikes Only in the Short Term
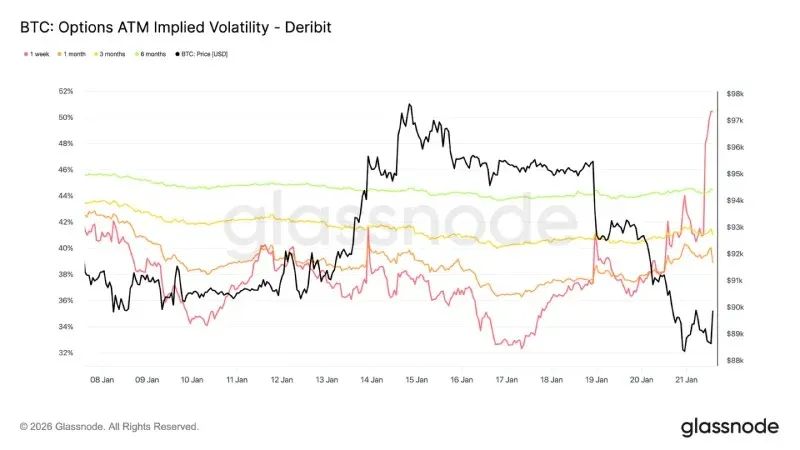
Spot‑market sell‑offs triggered by macro‑economic and geopolitical headlines have only lifted short‑term implied volatility. Since the decline that began last Sunday, one‑week implied volatility has risen by more than 13 volatility points, whereas the three‑month implied volatility has increased by roughly 2 points, and the six‑month figure has barely moved.
The steepening of the front end of the volatility curve indicates that traders are making tactical, event‑driven adjustments rather than revising their medium‑term risk outlooks. Short‑term volatility shifts reflect immediate uncertainty, not a fundamental re‑pricing of the longer‑term volatility regime.
Short‑Term Options Skew Fluctuates Sharply
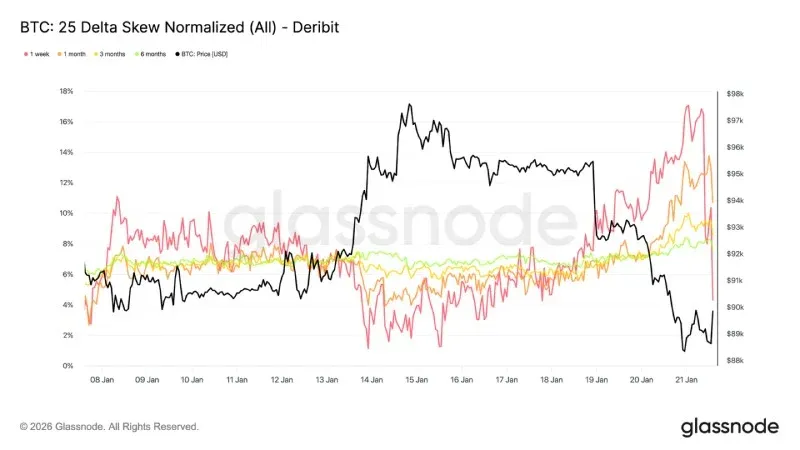
- The 25Δ skew for the one‑week horizon, which was near neutral a week ago, has quickly turned to a “puts‑more‑expensive” stance.
- Since last week the skew has moved roughly 16 volatility points toward puts, pushing put‑premium levels close to 17 %.
- One‑month skew shows a similar, though less pronounced, shift; the longer‑dated skew was already in put territory and has only deepened marginally.
Sharp skew swings usually accompany localized extreme moves, when market positions become crowded and the prevailing trend struggles to persist. After the market digested comments from the Davos forum, the downward‑bias premium was partially taken profit, prompting the skew to retreat swiftly.
Volatility Risk Premium Stays Elevated
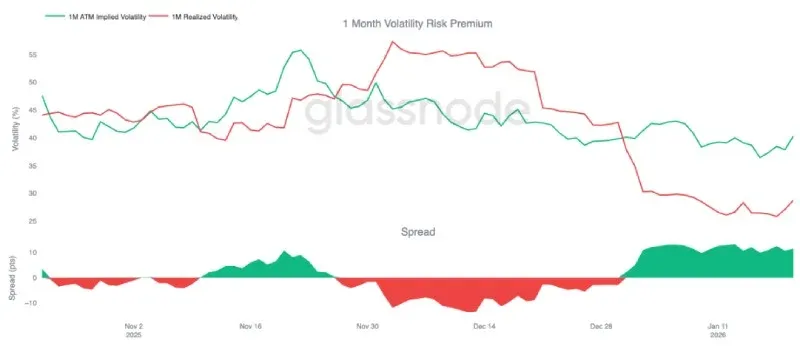
The one‑month volatility risk premium has remained positive since the start of the year. Even though implied volatility sits at historically low absolute levels, its pricing is still above the realized volatility, meaning options are “expensive” relative to actual price swings.
The risk premium is calculated as the difference between implied and realized volatility. A positive premium signals that option writers are being compensated for bearing volatility risk, creating an arbitrage opportunity for “short‑volatility” strategies—provided realized volatility stays contained, a short‑gamma position can generate returns. This self‑reinforcing dynamic suppresses volatility spikes. As of January 20, the one‑month volatility spread was about 11.5 volatility points, remaining favorable to sellers.
Dealers Shift to Net‑Short Gamma
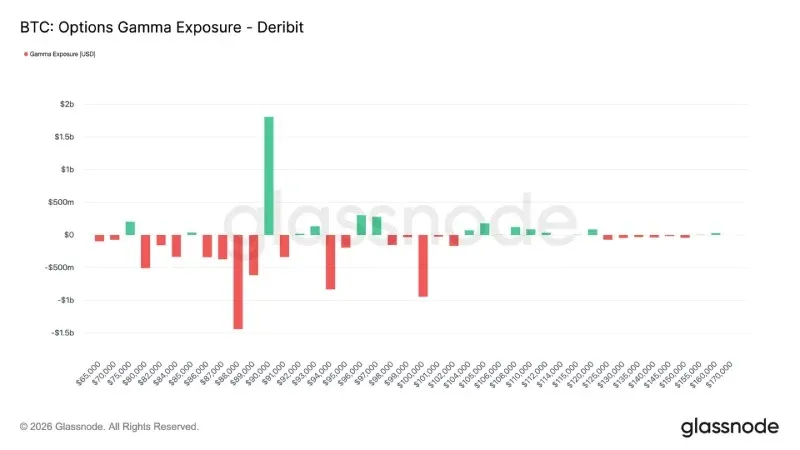
Dealer gamma exposure is a key structural force shaping short‑term price behavior. Recent capital‑flow data show that investors have been actively buying downside protection, pushing dealers into net‑short gamma positions below $90,000. At the same time, some participants have sold upside call options to finance those purchases, leaving dealers net‑long gamma above $90,000.
This creates an asymmetric landscape: below $90,000, dealers hold short gamma, meaning a price drop could trigger their hedging (selling futures or spot) and accelerate the decline; above $90,000, dealers’ long gamma acts as a stabilizer, with upward moves prompting them to buy, thereby damping the rally.
Consequently, price behavior under $90,000 may remain fragile, and the $90,000 level itself becomes a critical friction point. For a sustained breakout, the market needs sufficient momentum and confidence to absorb dealer hedging flows and push gamma exposure to higher price bands.
Summary
Bitcoin’s market remains in a low‑participation phase. Current price action is driven more by a reduction in sell pressure than by a wave of aggressive buying. On‑chain metrics continue to flag supply surplus and fragile structural support. Spot‑market capital flows have improved modestly but have not yet translated into a persistent buying trend.
Institutional demand stays cautious; treasury flows hover near the zero line, with activity limited to sporadic trades. The derivatives arena is thin, futures volume has shrunk, and leverage use is restrained, together creating a low‑liquidity environment where even modest position changes can move price sharply.
The options market mirrors this restraint. Volatility re
Related Reading
- 2026 Bitcoin Market Outlook: Bear Bounce or New Bull Run?
- Bitcoin Sharpe Ratio Hits Historic Lows as Bear Market Turns
- Why Bitcoin Struggles to Break the $100,000 Resistance Level
💡 Register on Binance with referral code B2345 for the maximum trading fee discount. See Binance complete guide.



