
 Bitaigen Research
In Bitcoin’s recent price action, the market appears poised for a potential fifth consecutive bearish monthly candle, which would break the longest streak of monthly declines since 2018. Although the overall trend is downward, the performance in March may still have delivered a modest positive return for holders.
In this article we dissect the technical signals behind Bitcoin’s new monthly‑loss high, compare them with patterns observed in previous bear markets, and explore whether early signs of a rebound are emerging. By examining the Relative Strength Index (RSI), historical cycles, and market sentiment from multiple angles, we aim to give position‑holders a more objective view of the opportunities that could arise in the next phase.
The Market Is “Fundamentally Different” Now
Veteran analyst Sykodelic points out that the current bear market differs fundamentally from earlier cycles—the monthly RSI has fallen to the lows seen in the 2015 and 2018 downturns. Unlike bull markets, where the RSI typically does not exhibit a pronounced over‑bought expansion, Sykodelic warns that relying on symmetrical corrections from past years can lead to mis‑interpretation.
“This feels more like the 2020 environment than any other period,” Sykodelic wrote on X, adding:
“I see no evidence that we are in the classic bear‑market pattern of the past; every participant should recognize these differences.”
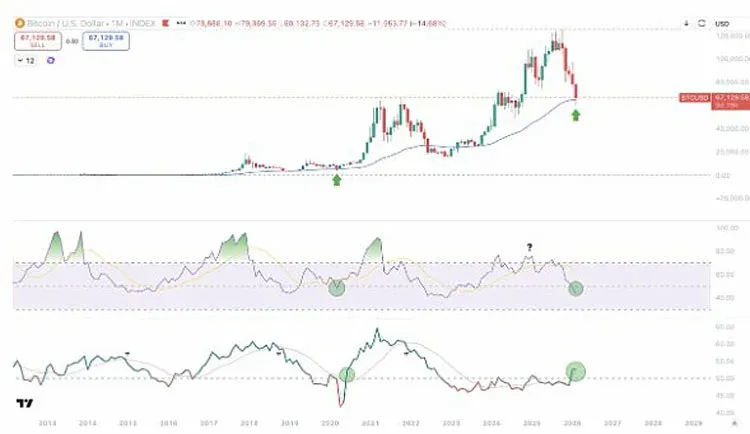
*BTC/USD monthly chart. Source: Sykodelic*
After Several Months of Decline, Prices Have Generated a 300% Surge
Historical data from CoinGlass indicates that Bitcoin has posted five straight months of price drops, with this month’s decline around 15% and the previous four months closing in negative territory. The last time a similar pattern occurred was in 2018, after Bitcoin’s record‑high in 2017 ushered in a prolonged bear market.
“We previously experienced six consecutive red months in 2018/19,” wrote an analyst from the investment platform Milk Road on X, adding: “The subsequent five‑month return exceeded 316%. If history repeats, a reversal could start around April 1.”
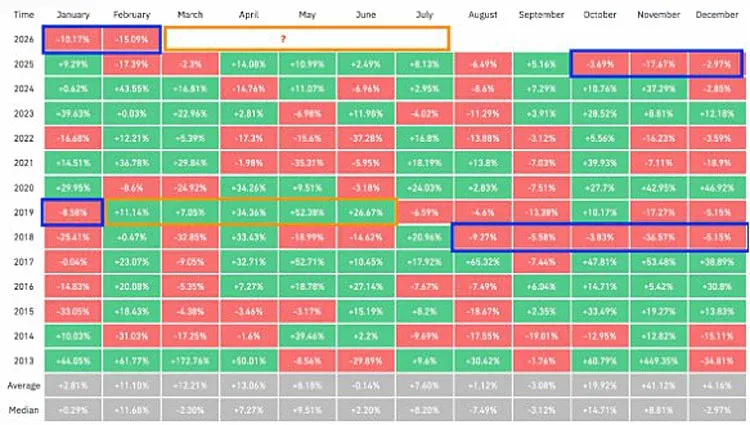
*Bitcoin monthly percentage returns. Source: CoinGlass*
Looking at the quarterly performance of the 2022 bear market, the cycle delivered four consecutive quarters of negative growth, accumulating a loss of roughly 64%. Bitcoin closed the year at $16,500 against the US dollar, down from a $46,230 opening price at the start of the year—one of the sharpest retracements on record. Several analysts at Cointelegraph believe that 2026 could usher in a new bear phase; if the fourth‑quarter downtrend persists, the price may breach the critical $60,000 barrier.
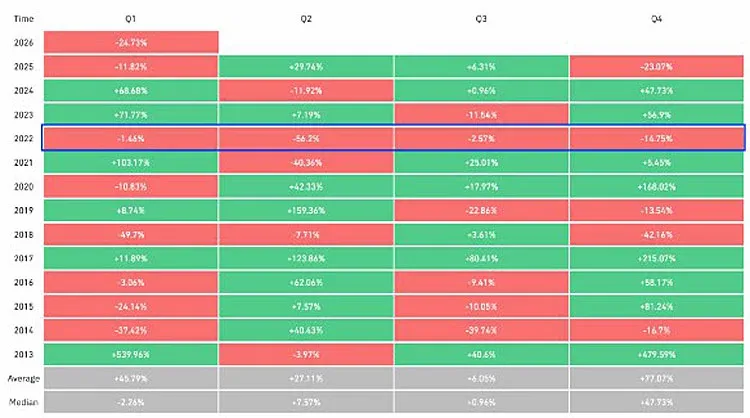
*Bitcoin monthly percentage returns. Source: CoinGlass*
Solana Sensei approaches the analysis from a weekly perspective, noting that Bitcoin has now closed five consecutive weekly candles in negative territory. This marks the longest weekly losing streak since 2022 and the second‑longest ever recorded. During 2022, Bitcoin fell from $46,800 to $20,500 within nine weeks.
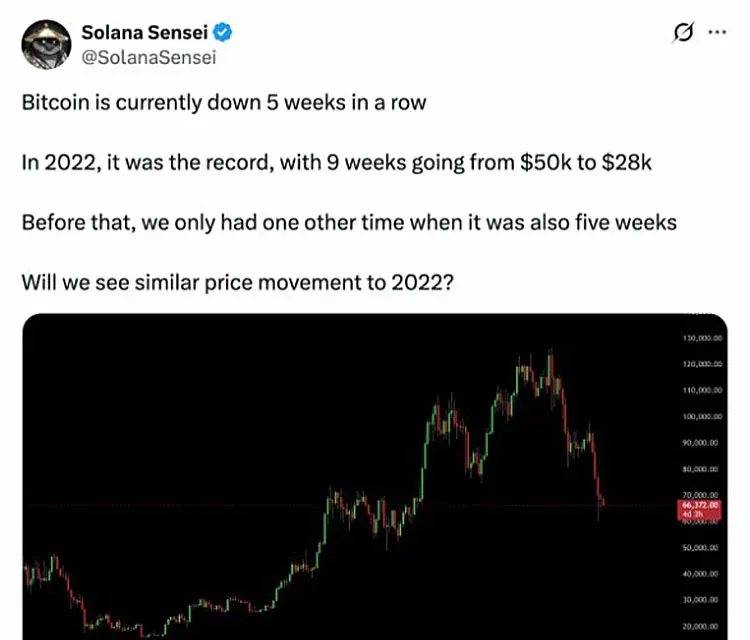
*BTC/USD weekly chart. Source: Solala Sensei*
In summary, while monthly metrics hint at an imminent rebound, the quarterly and weekly trends observed in 2022 suggest that the downtrend could last longer than many anticipate. A significant shift in market structure may be signaling that a bottom is forming, and any subsequent rally could surpass the expectations of most traders.
Note on fiat transactions: When converting crypto proceeds to fiat, the global market typically uses USD via SEPA or SWIFT transfers. Users residing in the United States should use Binance.US rather than the global Binance platform.
Tax disclaimer: Capital gains from cryptocurrency transactions may be taxable in your jurisdiction. Please consult a qualified tax professional for advice tailored to your situation.
The above constitutes a comprehensive interpretation of Bitcoin’s (BTC) record‑high monthly loss, the historical patterns that may be pointing toward a rebound, and the broader market context. For further updates, stay tuned to Bitaigen’s (比特根) ongoing coverage.
Related Reading
- Bitcoin Drop: Fund Deleveraging, Short‑Gamma & ETF Links
- Bitcoin Address Guide: How It Works, Formats & Creation
- Bitcoin at $65k, Ethereum $3.1k, TON tops Dogecoin
💡 Register on Binance with referral code B2345 for the maximum trading fee discount. See Binance complete guide.



