
 Bitaigen Research
 2026-02-11 – The cryptocurrency market entered a pivotal turning point amid heightened panic. Bitcoin (BTC) briefly surged past $70,000 but is now oscillating weakly in the $69,000‑$69,500 range.
Combining technical analysis, on‑chain holdings, and institutional capital flows, Bitcoin presently enjoys sufficient support and liquidity, suggesting that a reconquest of the $70,000 threshold could be plausible in the near term.

By integrating three perspectives—technical chart patterns, on‑chain metrics, and institutional behavior—we dissect Bitcoin’s short‑term support strength and potential rebound pathways. A deep dive into market sentiment and the tug‑of‑war between buyers and sellers yields the core logic behind a possible break of the psychological barrier, furnishing investors with the key clues needed to navigate the next price cycle.
Psychological Barrier Breached: Can Bitcoin Return to $70,000?
The $70,000 level has become a major psychological anchor for the market. Over the past several months this round number has been treated as the defensive line of a new bull‑market phase; once the price sits above it, any pull‑back is labeled a “controlled retreat,” whereas a break beneath instantly fuels narratives of a “double‑top” or a “bull‑to‑bear” reversal.
- The current market exhibits a classic “bull trap” liquidation. The rally to $71,500 attracted a flood of highly leveraged, chase‑long capital, which now finds itself trapped above $70,000.
- $68,500 hosts a solid spot‑buy wall and weekly‑timeframe support. If Bitcoin can stabilize there and form a textbook W‑bottom pattern, the $70,000 level is likely to flip from resistance to support.
Market makers often weaponize round numbers to stir sentiment. A dip below $70,000 triggers a cascade of stop‑loss orders, turning selling pressure into low‑price liquidity for accumulation. Social‑media slogans such as “Below $70k – run!” frequently precede the formation of a short‑term bottom. Historical data show that deep corrections in the mid‑bull cycle tend to weed out weak‑hand speculators, lightening the load for the next upward thrust.
Macro‑Liquidity Floodgate: Can Bitcoin Re‑Climb to $70,000?
From a macro perspective, Bitcoin is no longer a pure speculative token; it has evolved into a hedge against fiat depreciation and excessive liquidity. The U.S. Federal Reserve’s monetary stance and the global liquidity cycle remain the primary drivers of price.
- In the short run, fluctuations in the CPI cause the U.S. Dollar Index (DXY) to rebound, putting pressure on risk assets.
- Over the longer horizon, central banks worldwide are still on a rate‑cut trajectory, and global M2 money supply continues to rise. Bitcoin behaves like a vessel floating on water: as long as the water level (liquidity) climbs, the hull (price) will be buoyed upward.
During the recent slip below $70,000, U.S. Treasury yields did not spike dramatically, indicating that macro‑level liquidity has not been exhausted. Absent a systemic financial crisis, capital will continue to gravitate toward the scarce “digital gold” – Bitcoin. Consequently, unless the Fed resorts to an aggressive rate‑hike, the existing liquidity cushion should be ample to help the price reclaim lost territory.
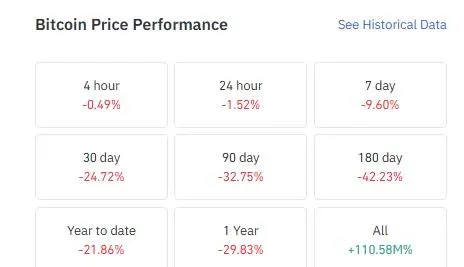
On‑Chain Data Unveiled: Can Bitcoin Return to $70,000?
On‑chain metrics reveal the real flow of each Bitcoin and constitute a decisive gauge of whether price recovery is feasible. Two indicators deserve special attention:
- Long‑Term Holder (LTH) Net Position Change
- Exchange Reserves
Within the 48 hours after the breach of $70,000, on‑chain data showed an extremely low willingness among LTHs to sell. Addresses that have held coins for more than 155 days did not exhibit large‑scale outbound transfers, suggesting that the primary sellers are recent, short‑term holders (STH) who are highly sensitive to price swings and prone to panic selling. The migration of tokens from weak hands to strong hands is a prerequisite for a bottoming process.
Furthermore, Bitcoin held on exchanges has sunk to historic lows. Although the price fell, there was no surge of massive deposit‑driven sell‑offs. Withdrawal activity remains robust, indicating that sizable funds are using the $69,000 corridor to buy in the over‑the‑counter (OTC) market and move the assets into cold storage. A tight supply‑demand balance furnishes a physical underpinning for a price rebound.
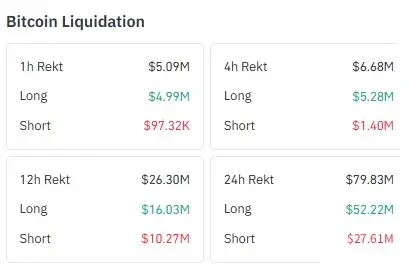
Derivatives Clean‑Up Boosts Bitcoin’s Path Back to $70,000
The health of the derivatives market directly influences the vigor of any rebound. Key monitoring metrics include:
- Open Interest (OI)
- Funding Rate
After the price slipped below $70,000, overall OI dropped markedly, indicating that a large cohort of leveraged longs was forcibly liquidated. This deleveraging provides a healthy signal that the market may be approaching a bottom. If leverage ratios and positive funding rates remain elevated, it becomes difficult for major players to mount a coordinated push upward; the current OI reduction acts like a “drainage surgery,” freeing up room for the next rally.
Funding rates have fallen from 0.05 % at the $71,500 peak to 0.01 % around $69,000, and in some venues have even turned negative. A negative funding rate forces short‑sellers to pay longs, often foreshadowing a short‑squeeze scenario. Should price climb and trigger short‑stop‑losses, a cascade of liquidations could supply fresh momentum for Bitcoin to breach the $70,000 mark once again.
Institutional ETF Flows Determine Bitcoin’s Return to $70,000
By 2026, Bitcoin has completed its transition from a grassroots asset to a mainstream Wall Street instrument. The capital flows into institutional ETFs—such as BlackRock’s IBIT and Fidelity’s FBTC—serve as a barometer for price recovery prospects.
- Monitoring data shows that while the net inflow velocity has modestly slowed, there has been no large‑scale net outflow, implying that institutions remain bullish on the long‑term outlook.
- Institutional cost bases are clustered between $55,000 – $65,000, reflecting long‑term positioning that is unlikely to be abandoned on the basis of short‑term volatility.
A panic‑driven redemption wave would lengthen the recovery timeline, but current signals suggest that institutions are using the pull‑back to rebalance their allocations. Once price stabilizes, a renewed net inflow is expected. The depth of institutional capital establishes a “hard floor” near $68,000.
Miner Economics Perspective
The halving effect has fully manifested by 2026, and miners’ production costs now act as a hard price support. The latest hashrate figures reveal no significant decay, indicating that miners continue to operate even under breakeven or marginal profit conditions, and that there has been no mass “miner capitulation.” Around the $69,000 level, higher‑cost miners may opt to hoard their output, further dampening market‑wide sell pressure.
When sell pressure eases and both institutional and opportunistic bottom‑catchers keep flowing in, the supply‑demand imbalance will push the price upward. Should the price linger well below $70,000 for an extended period, a substantial number of mining rigs would have to be shut down, jeopardizing network security—a feedback loop that also nudges price back toward miner‑friendly levels.
Retail Playbook: Can Bitcoin Get Back to $70,000?
In the $69,000‑$69,500 corridor, the risk‑reward ratio already leans toward the long side. Retail participants can consider the following approaches based on their position size:
- Light Exposure: Employ staggered dollar‑cost averaging or grid trading. Set a buy grid between $68,000 – $71,000, adding a position every $1,000 dip and taking profit every $1,000 rise to lower the average entry price.
- Heavy, Underwater Positions: To avoid panic‑driven exits, a trader might hedge with a 1× futures short contract for a short‑term cover. Close the hedge once the price recovers above $70,500, thereby reducing downside risk during the correction phase.
Closing Thoughts: The Battle of Conviction
Weaving together technical, on‑chain, capital‑flow, and macro‑economic strands, Bitcoin enjoys a solid foundation at the $68,500 support level, and the embryonic W‑bottom pattern is already visible. Leveraged liquidation is nearing its end, funding rates are normalizing, and institutional ETFs continue to record steady inflows, indicating that long‑term capital has not fled. The loss of the $70,000 psychological line appears more as a tactical retreat within the broader bull‑bear contest rather than a strategic defeat.
At the 2026‑02‑11 inflection point, panic served as a poison for retail traders but a banquet for the dominant players. Every breach of a key round number can carve out a golden window for the courageous. Maintain patience, hold onto your tokens, and when market sentiment lifts, the price could once again settle above $70,000—and perhaps climb even higher.
---
This concludes the overview of “Bitcoin Price Forecast: Can Bitcoin Return to $70,000? A Multi‑Angle Analysis.” For additional Bitcoin price perspectives, explore historical articles from Bitaigen or follow the related links below. Thank you for your continued interest and support!
*Note: Cryptocurrency gains may be taxable in many jurisdictions. Participants should consult local tax regulations or a qualified tax professional to understand their obligations.*
*For U.S. residents, trading on the global Binance platform is not permitted; they must use Binance.US or another regulated U.S. exchange.*
Related Reading
- Bitcoin Rebound: Technical & On‑Chain for HYPE & KAS
- Who Is Satoshi Nakamoto? Bitcoin's Anonymous Founder & 1.1M BTC Mystery
- Satoshi Nakamoto Identity & Bitcoin Holdings Traced
💡 Register on Binance with referral code B2345 for the maximum trading fee discount. See Binance complete guide.



